Fig. 22.
Download original image
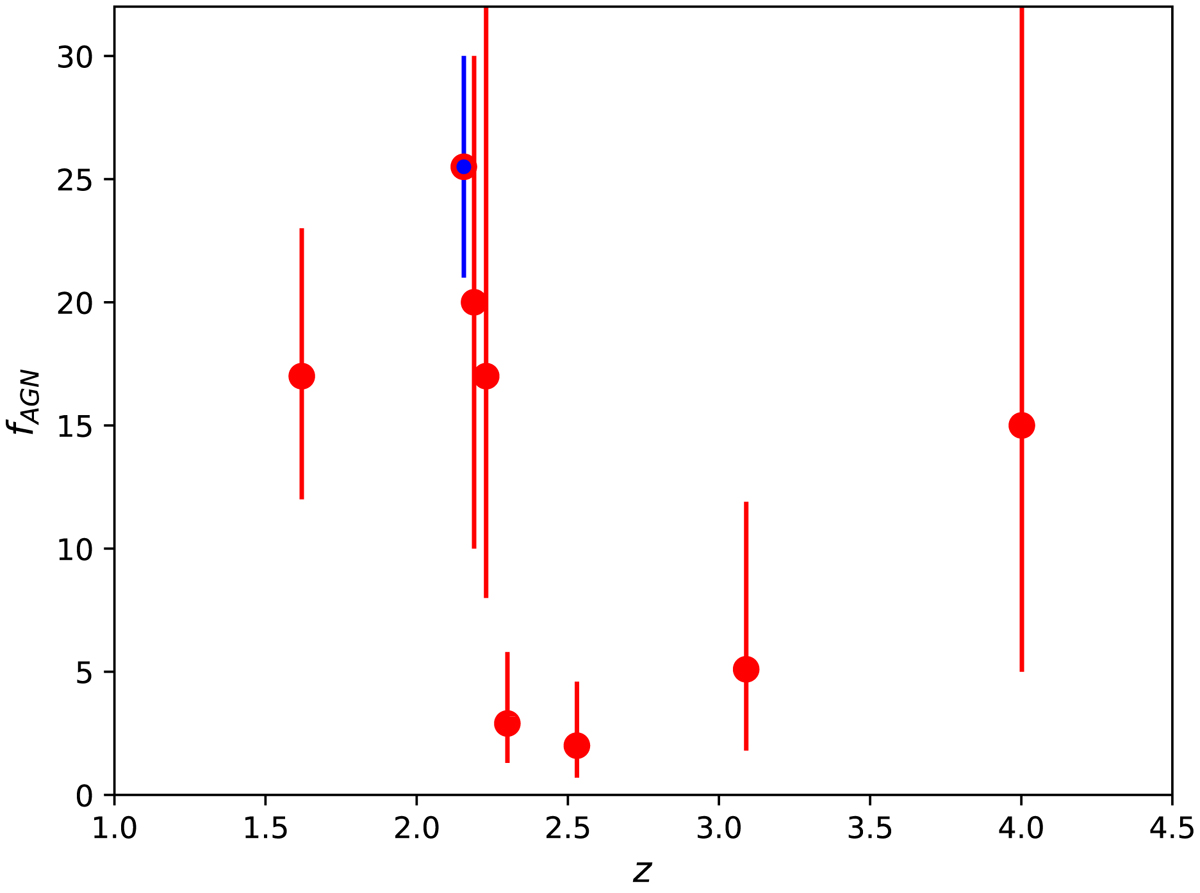
Fraction of X-ray AGN over the total number of identified protocluster members from Table 6. The Spiderweb Protocluster is marked with a blue dot. The plot is meant to show measurements of the AGN fraction available in the literature, and necessarily includes measurements for different populations and different stellar mass ranges.
Current usage metrics show cumulative count of Article Views (full-text article views including HTML views, PDF and ePub downloads, according to the available data) and Abstracts Views on Vision4Press platform.
Data correspond to usage on the plateform after 2015. The current usage metrics is available 48-96 hours after online publication and is updated daily on week days.
Initial download of the metrics may take a while.