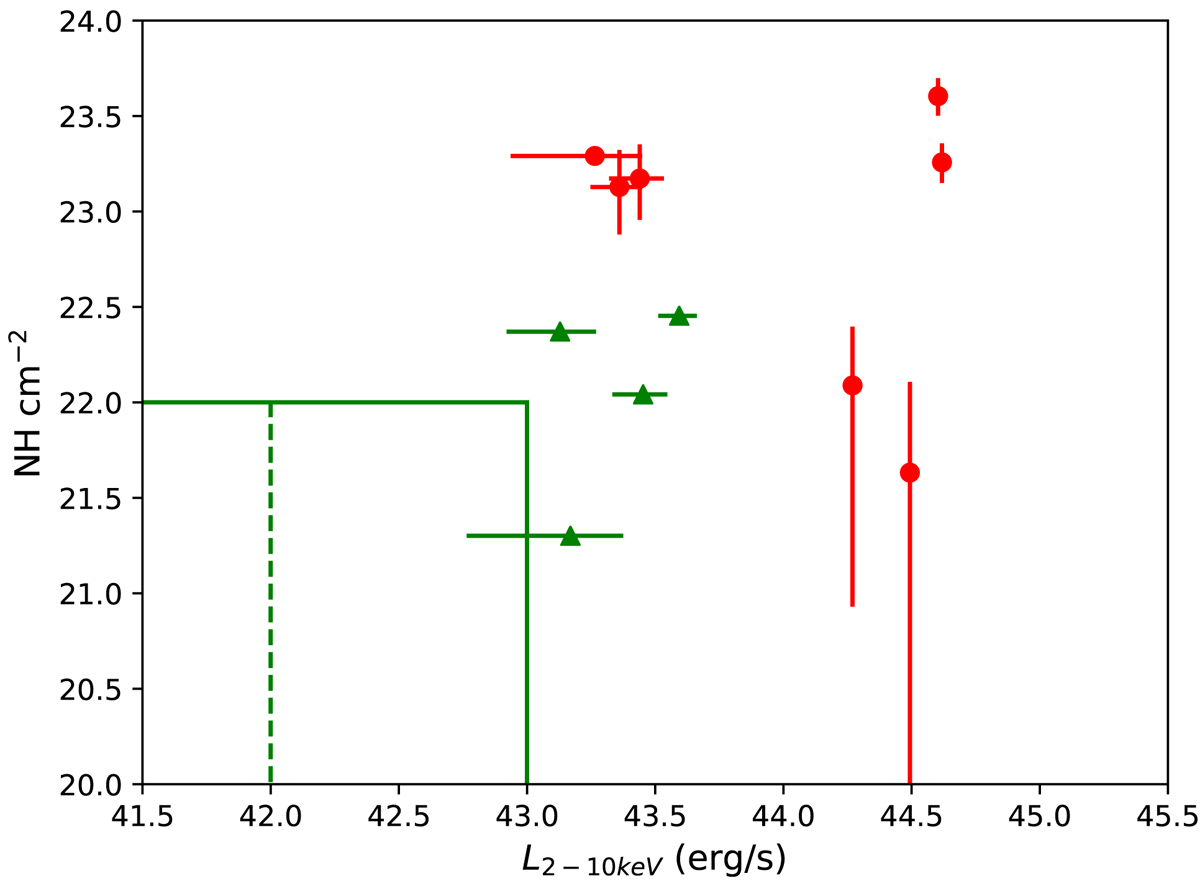
Fig. 16.
Download original image
Scatter plot of NH and L2 − 10 keV for 11 sources (excluding the Spiderweb and the two Compton-thick candidates). Red circles correspond to measured NH values, while green triangles to 1σ upper limits. The green box shows the parameter space still consistent with star formation at the level of 1000 M⊙ yr−1 or 100 M⊙ yr−1 (vertical dashed line).
Current usage metrics show cumulative count of Article Views (full-text article views including HTML views, PDF and ePub downloads, according to the available data) and Abstracts Views on Vision4Press platform.
Data correspond to usage on the plateform after 2015. The current usage metrics is available 48-96 hours after online publication and is updated daily on week days.
Initial download of the metrics may take a while.