Free Access
Fig. 13.
Download original image
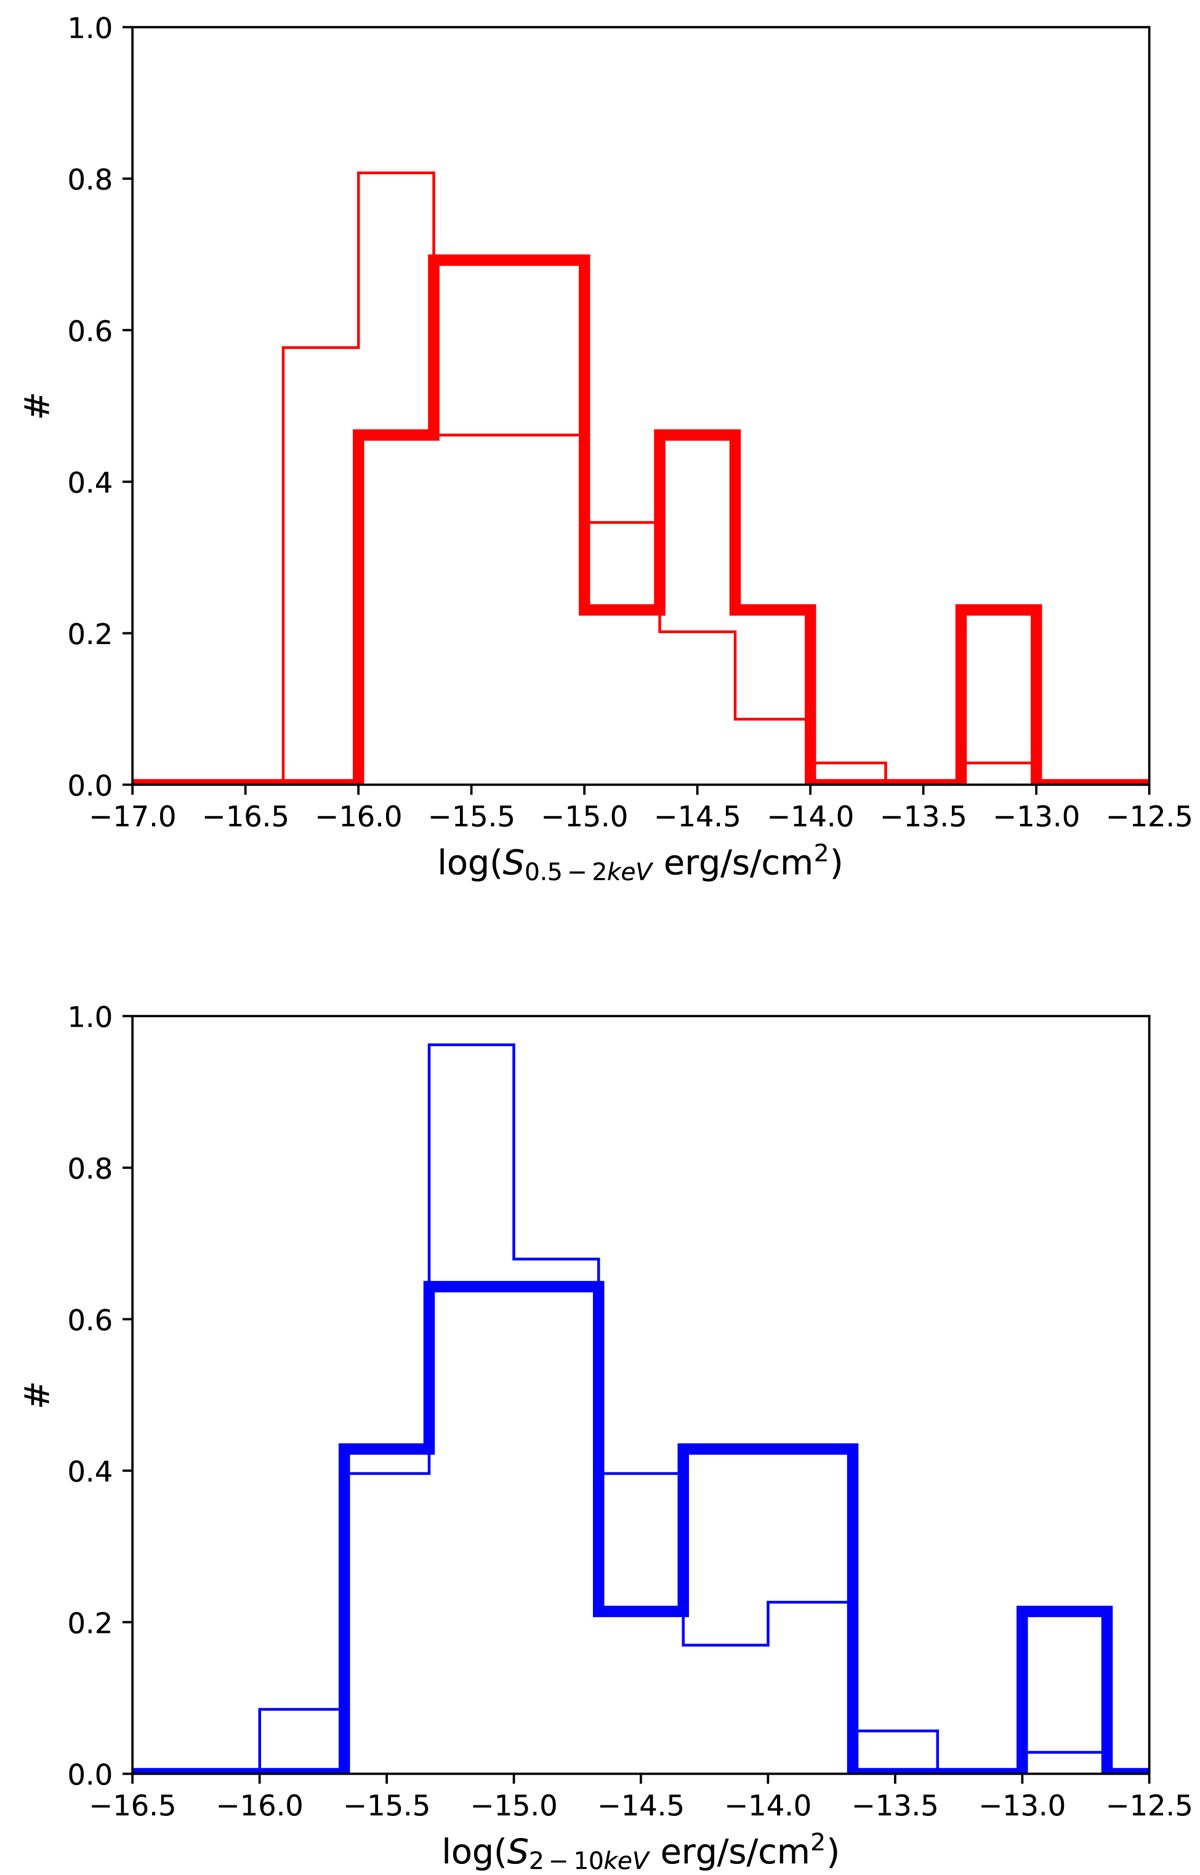
Flux distributions. Top panel: differential normalized distribution of the soft fluxes in the Spiderweb Galaxy field. The total sample of X-ray sources is shown with a thin line, while the subsample of the 14 protocluster members is shown with a thick line. Bottom panel: same as in the top panel but in the hard band.
Current usage metrics show cumulative count of Article Views (full-text article views including HTML views, PDF and ePub downloads, according to the available data) and Abstracts Views on Vision4Press platform.
Data correspond to usage on the plateform after 2015. The current usage metrics is available 48-96 hours after online publication and is updated daily on week days.
Initial download of the metrics may take a while.