Fig. 1.
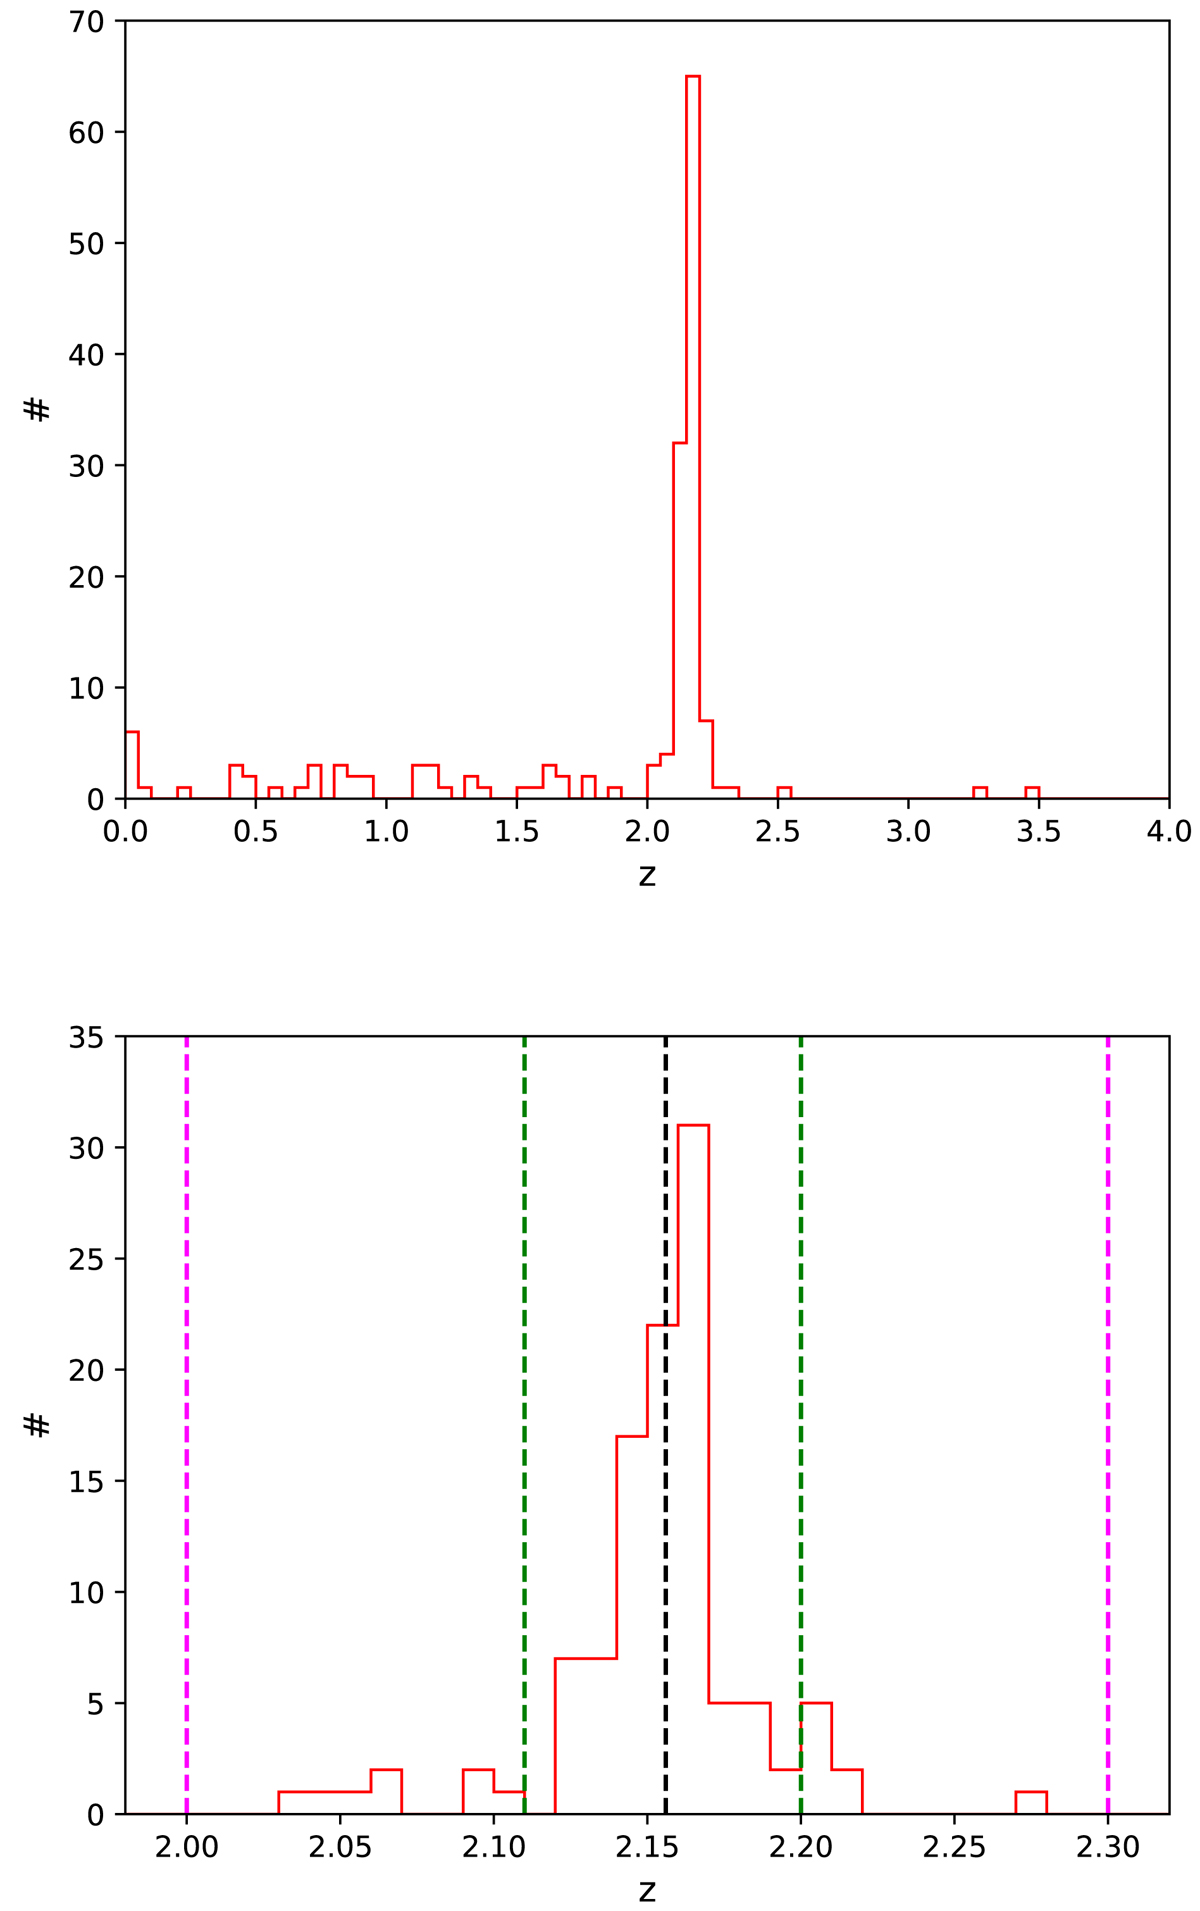
Download original image
Redshift distribution in the Spiderweb field. Upper panel: distribution of all the 161 spectroscopic redshifts measured in the field. Lower panel: redshift distribution in the range 2.0 < z < 2.3. Vertical dashed lines show the redshift of the Spiderweb Galaxy as measured with low resolution spectroscopy by van Ojik (1995) (black line), the range adopted to define the Spiderweb Complex (magenta lines) and the protocluster (green lines), as discussed in the text.
Current usage metrics show cumulative count of Article Views (full-text article views including HTML views, PDF and ePub downloads, according to the available data) and Abstracts Views on Vision4Press platform.
Data correspond to usage on the plateform after 2015. The current usage metrics is available 48-96 hours after online publication and is updated daily on week days.
Initial download of the metrics may take a while.