Fig. 3
Download original image
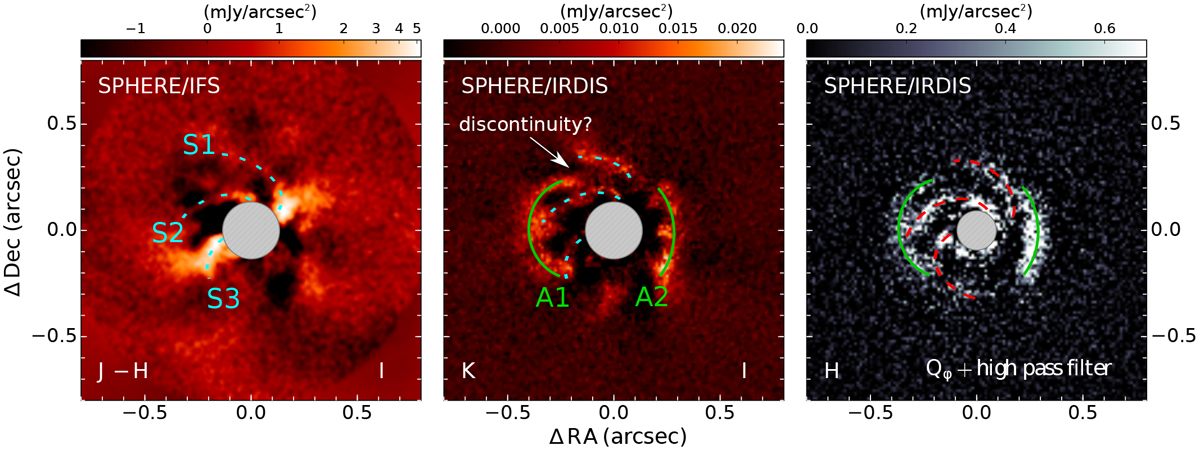
Left: SPHERE/IFS image after angular differential imaging was applied to remove the stellar light component. Center: SPHERE/IRDIS K-band image after angular differential imaging. Right: SPHERE/IRDIS H-band image after polarization differential imaging. A high pass filter was applied to highlight high spatial frequency features and make the image more comparable to the K-band and the IFS images. We mark similar features in all three images with dashed lines for the “spiral-like” features S1-S3 and with continuous lines for the “arc-like” features A1 and A2. In the center panel, we specifically point out the discontinuity between features S1 and A1 in the north. We note that the flux calibrations are not absolute values due to the varying throughput of the different data processing methods (this also explains the negative flux values). They can be used to follow variations within each panel but are not comparable between panels.
Current usage metrics show cumulative count of Article Views (full-text article views including HTML views, PDF and ePub downloads, according to the available data) and Abstracts Views on Vision4Press platform.
Data correspond to usage on the plateform after 2015. The current usage metrics is available 48-96 hours after online publication and is updated daily on week days.
Initial download of the metrics may take a while.