Fig. 6
Download original image
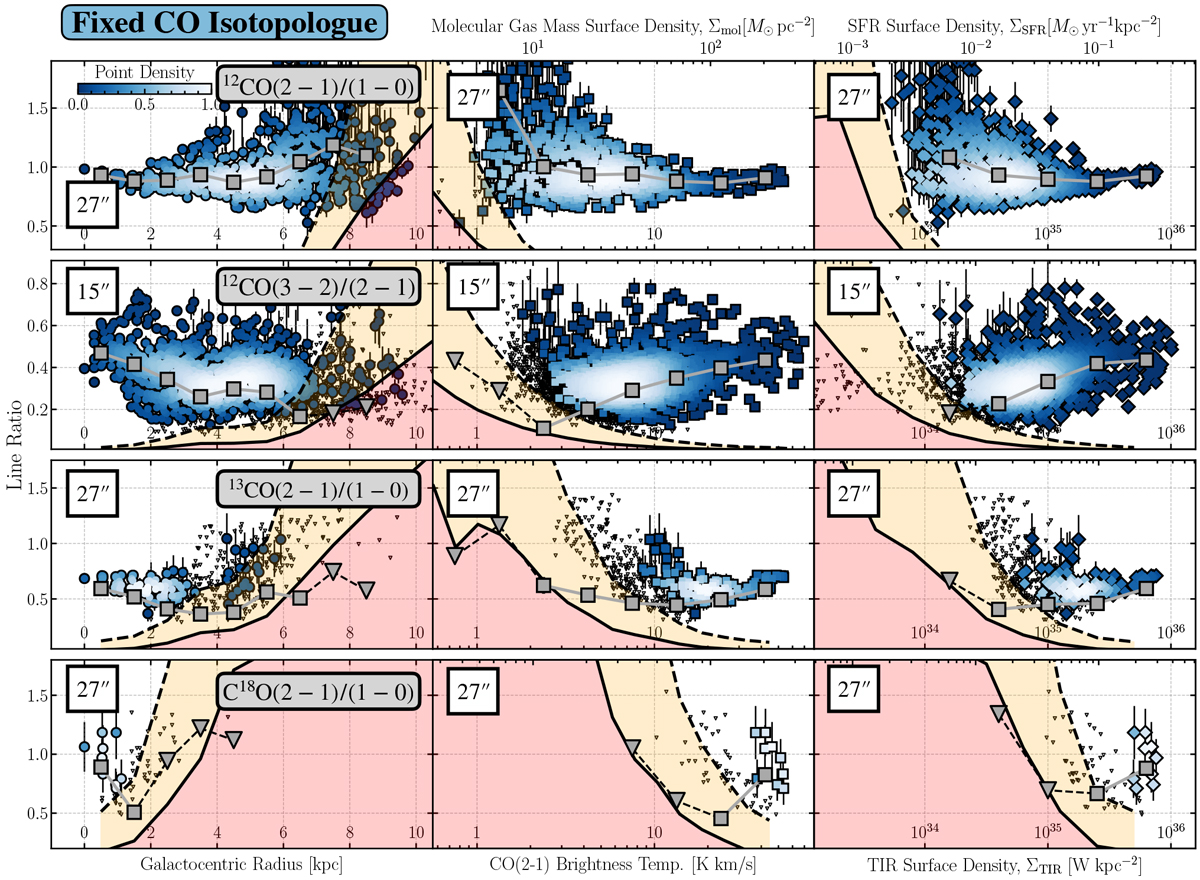
CO line ratios as a function of galactocentric radius, CO (2–1) brightness temperature, and TIR surface brightness. Each row shows the line ratio for individual lines of sight for fixed CO isotopologues but different transitions. Each column shows the CO line ratio as a function of galactocentric radius, CO (2–1) brightness temperature, and TIR surface brightness. The coloured data points show the individual lines of sight with a S/N > 5, and the small black downward triangles indicate 3σ upper limits. To illustrate the point density in the figure, we colour-code the points using a 2D KDE. Values are normalised to the peak density and range from most dense (1; white) to least dense (0; blue) The shaded area in each panel shows the 1σ (red) and 3σ (orange) censored regions for the individual lines of sight. They are an estimate of where we expect to no longer be able to detect line ratios (due to the low S/N of one of the lines). Marked in grey are the line ratios derived from the stacked spectra (downward triangles again mark upper limits). Error bars for significant points are indicated (for the stacked data points, the error bars are generally not visible due to the plotted point size being larger). For each line ratio, we used the highest resolution possible (indicated in the upper-left corner of the panel). To convert to Σmol, which we provide for comparison on the top x axis of each panel, we assume a constant R21 = 0.89. We note that the x and y axes are correlated if the 12CO (2–1) emission is used in the line ratio. The stacked points allow us to probe the line ratios in fainter regions, which sometimes confirms the trend suggested by the individual (significantly detected) sight line measurements (e.g. the 12CO (2–1)/(1–0) in the top panel row) and sometimes reveals trends that could not be identified from the sight line measurements (e.g. the trend in the 12CO (3–2)/(2–1) ratio in the second row).
Current usage metrics show cumulative count of Article Views (full-text article views including HTML views, PDF and ePub downloads, according to the available data) and Abstracts Views on Vision4Press platform.
Data correspond to usage on the plateform after 2015. The current usage metrics is available 48-96 hours after online publication and is updated daily on week days.
Initial download of the metrics may take a while.