Fig. 5
Download original image
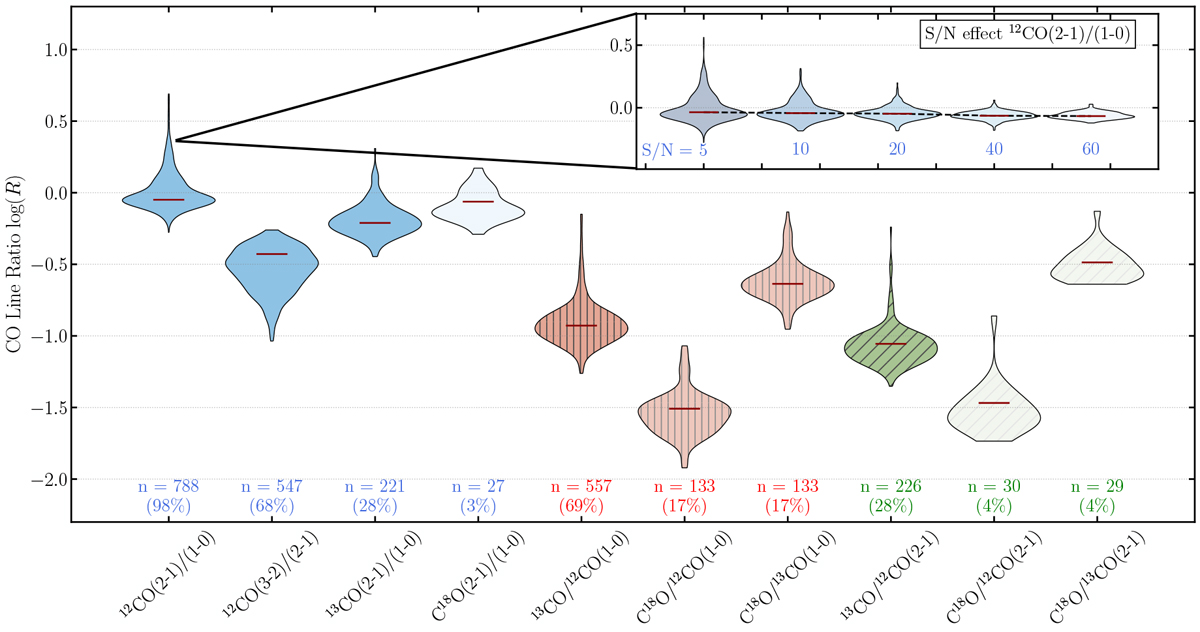
Distribution of CO line ratios at 27 arcsec. The violin plots are colour-coded: blue indicates ratios of fixed CO isotopologue but different transitions, while red (vertically hatched) and green (diagonally hatched) show ratios of different CO isotopologue but fixed transition. The number of significant data points (S/N > 5) for each line ratio is indicated with n and the saturation of the colour of each violin. The percentage in terms of total detection is also indicated (with respect to S /N > 5 detected 12CO(1–0) data points). In the inset panel, we show the effect of increasing the S/N cut from S /N = 5–60 for the 12CO(2–1)/(1–0) line ratio. We do not find a significant difference in terms of the mean line ratio with increasing S/N.
Current usage metrics show cumulative count of Article Views (full-text article views including HTML views, PDF and ePub downloads, according to the available data) and Abstracts Views on Vision4Press platform.
Data correspond to usage on the plateform after 2015. The current usage metrics is available 48-96 hours after online publication and is updated daily on week days.
Initial download of the metrics may take a while.