Fig. 3
Download original image
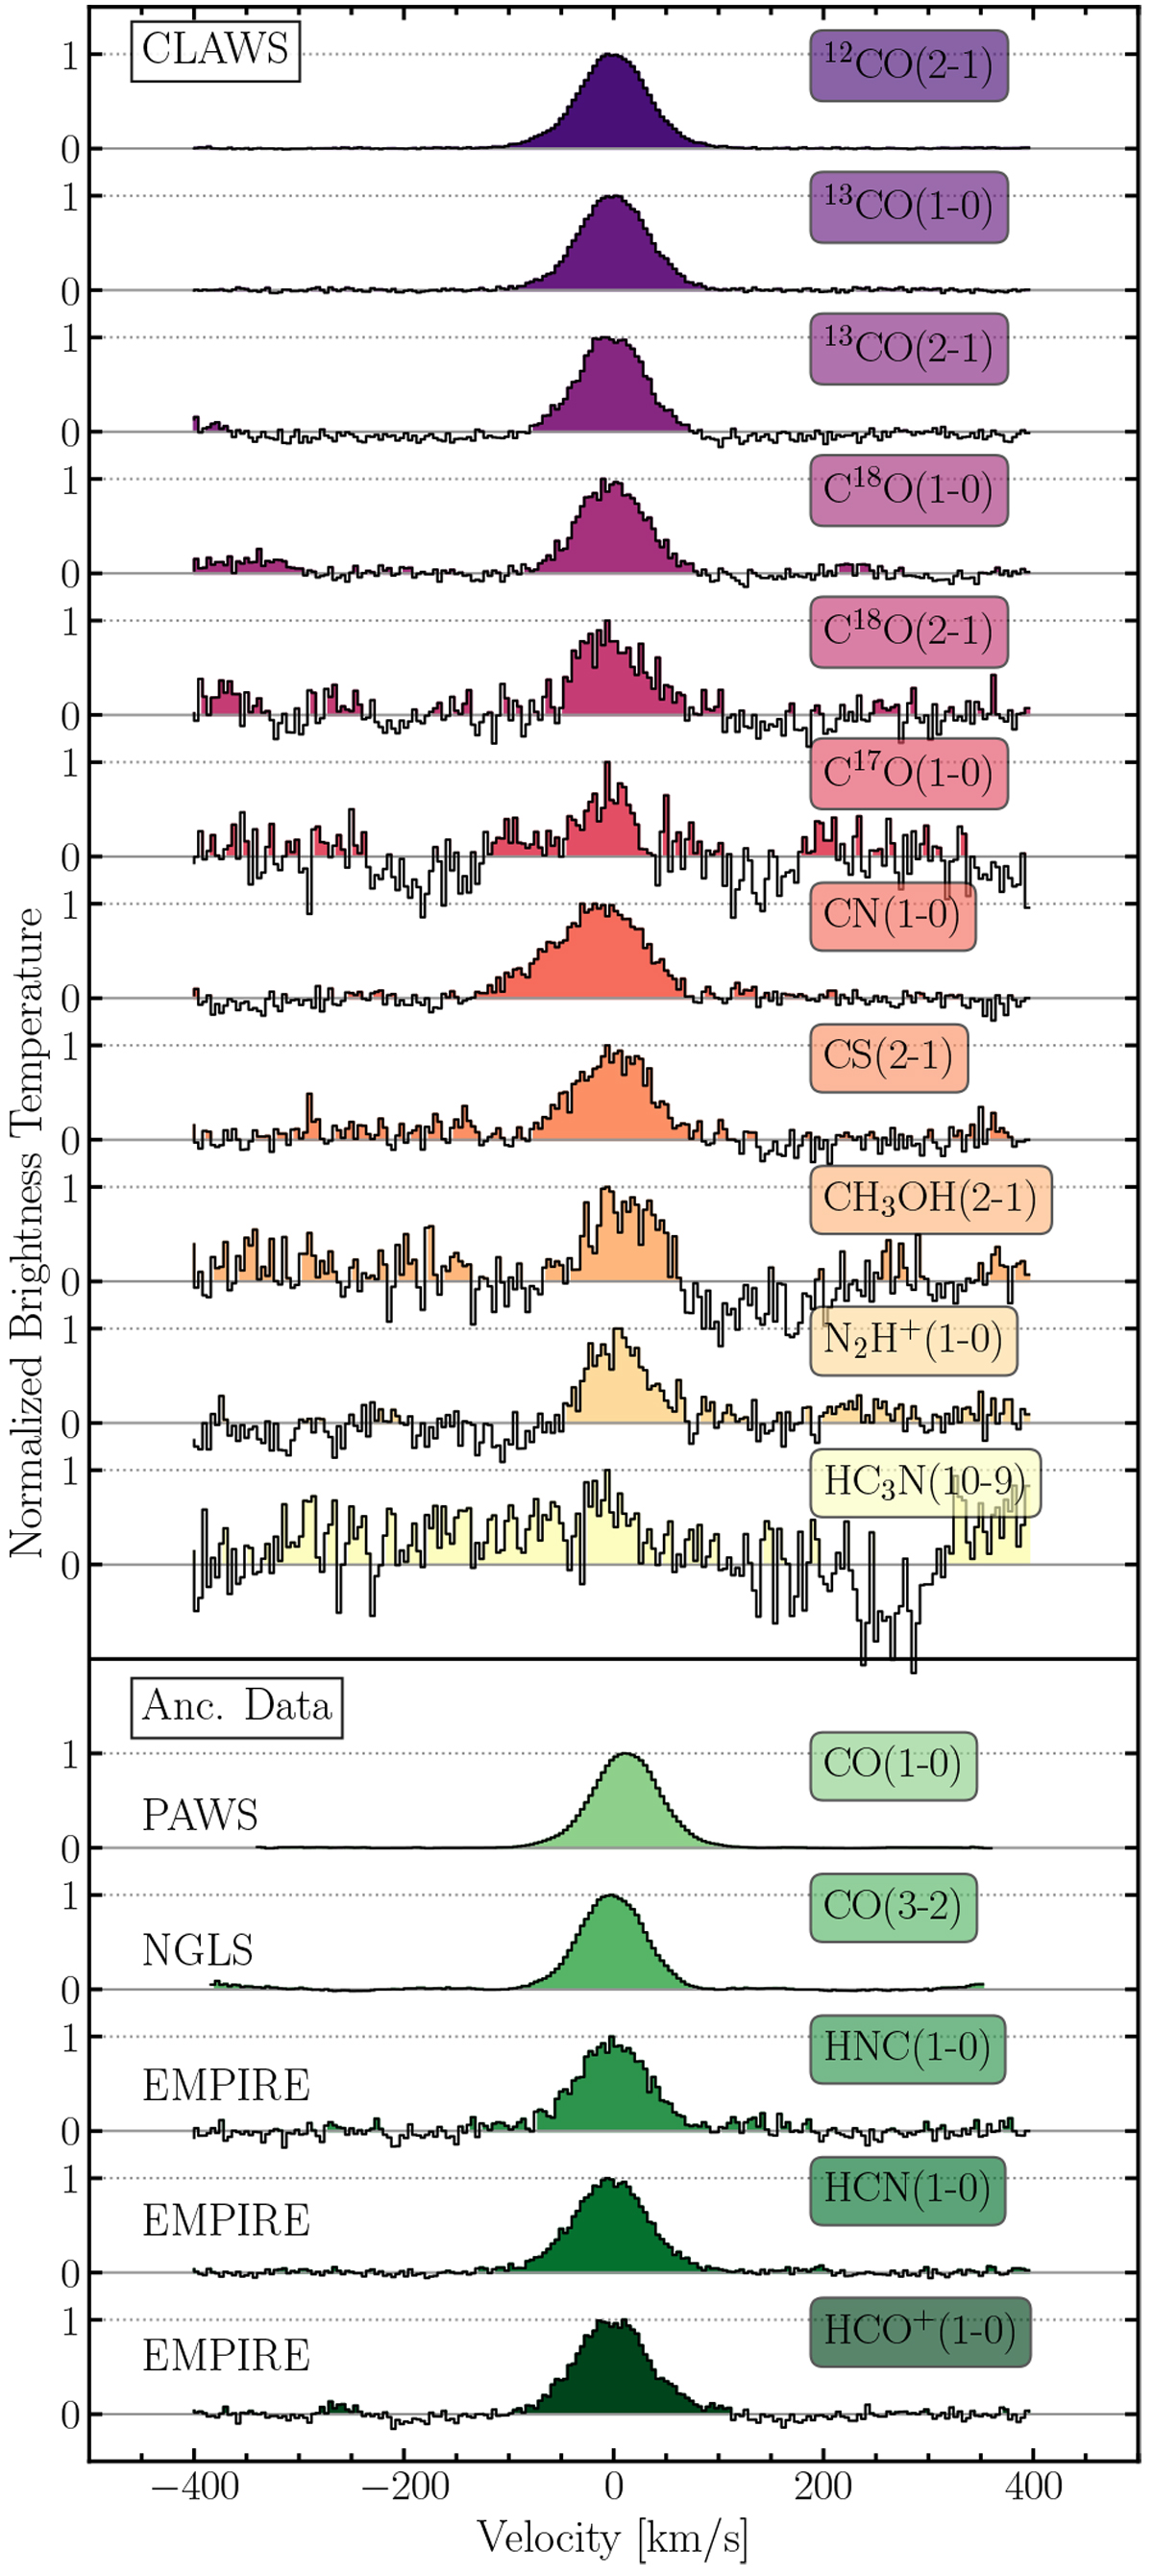
Spectra of emission lines covered by this programme stacked over the central 1.5 kpc region at 34”. The emission lines are normalised to the maximum in the spectrum. The five bottom spectra are taken from different observing programmes (see Sect. 2.4), while the spectra above come from this project. For the absolute intensities, we refer the reader to Table 3. We note that we employ a hexagonal, half-beam-sized sampling. The angular resolution of 34” corresponds to a physical scale of around 1.4kpc. Therefore, the stacked spectra over the central 1.5kpc region are thus the combination of the spectra of the seven most central sampling points.
Current usage metrics show cumulative count of Article Views (full-text article views including HTML views, PDF and ePub downloads, according to the available data) and Abstracts Views on Vision4Press platform.
Data correspond to usage on the plateform after 2015. The current usage metrics is available 48-96 hours after online publication and is updated daily on week days.
Initial download of the metrics may take a while.