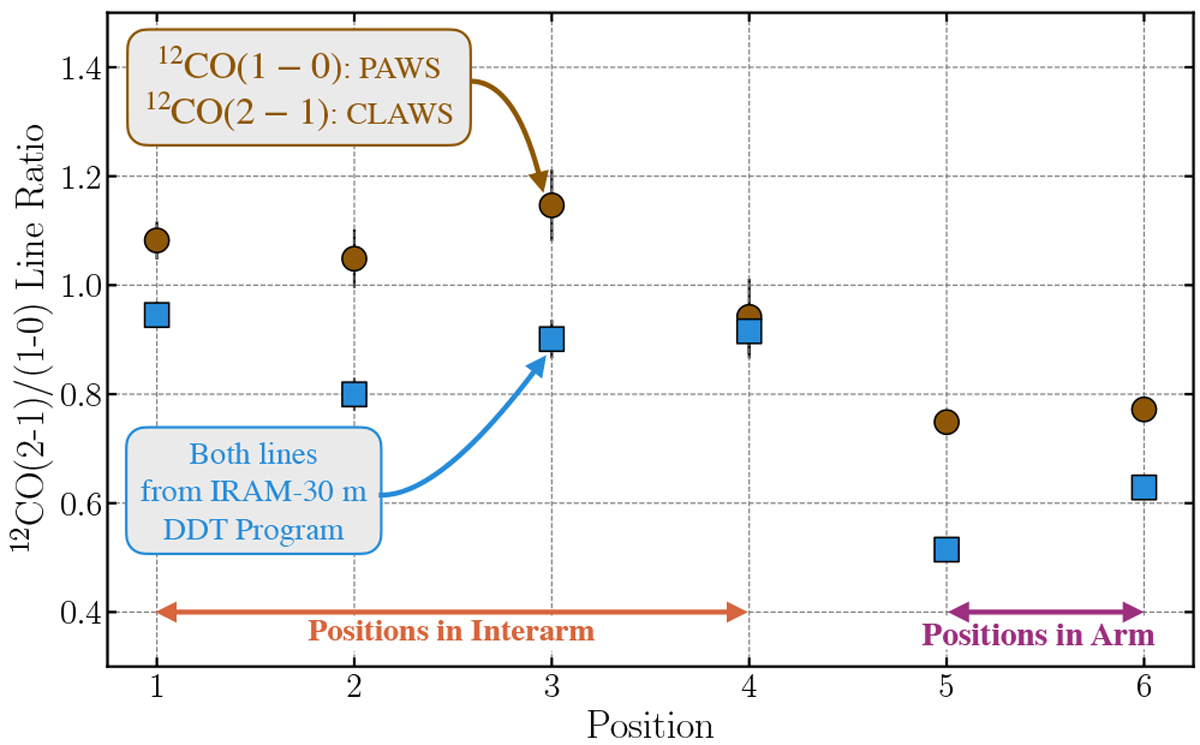
Fig. B.1
Download original image
Arm-interarm CO line ratio analysis. Circles indicate the 12CO (2–0) line ratio for lines extracted over the apertures shown in Figure A.2. The squares show the CO line ratio from the IRAM 30 m DDT project E02-20. Positions 1–4 are within the interarm of the galaxy, and positions 5 and 6 are in the spiral arm region. We see that both show larger line ratios in the interarm regions, leading us to conclude that the trend we find is not due to issues with the flux calibration uncertainties. The numerical values of the individual points are listed in Table B.1.
Current usage metrics show cumulative count of Article Views (full-text article views including HTML views, PDF and ePub downloads, according to the available data) and Abstracts Views on Vision4Press platform.
Data correspond to usage on the plateform after 2015. The current usage metrics is available 48-96 hours after online publication and is updated daily on week days.
Initial download of the metrics may take a while.