Fig. 2
Download original image
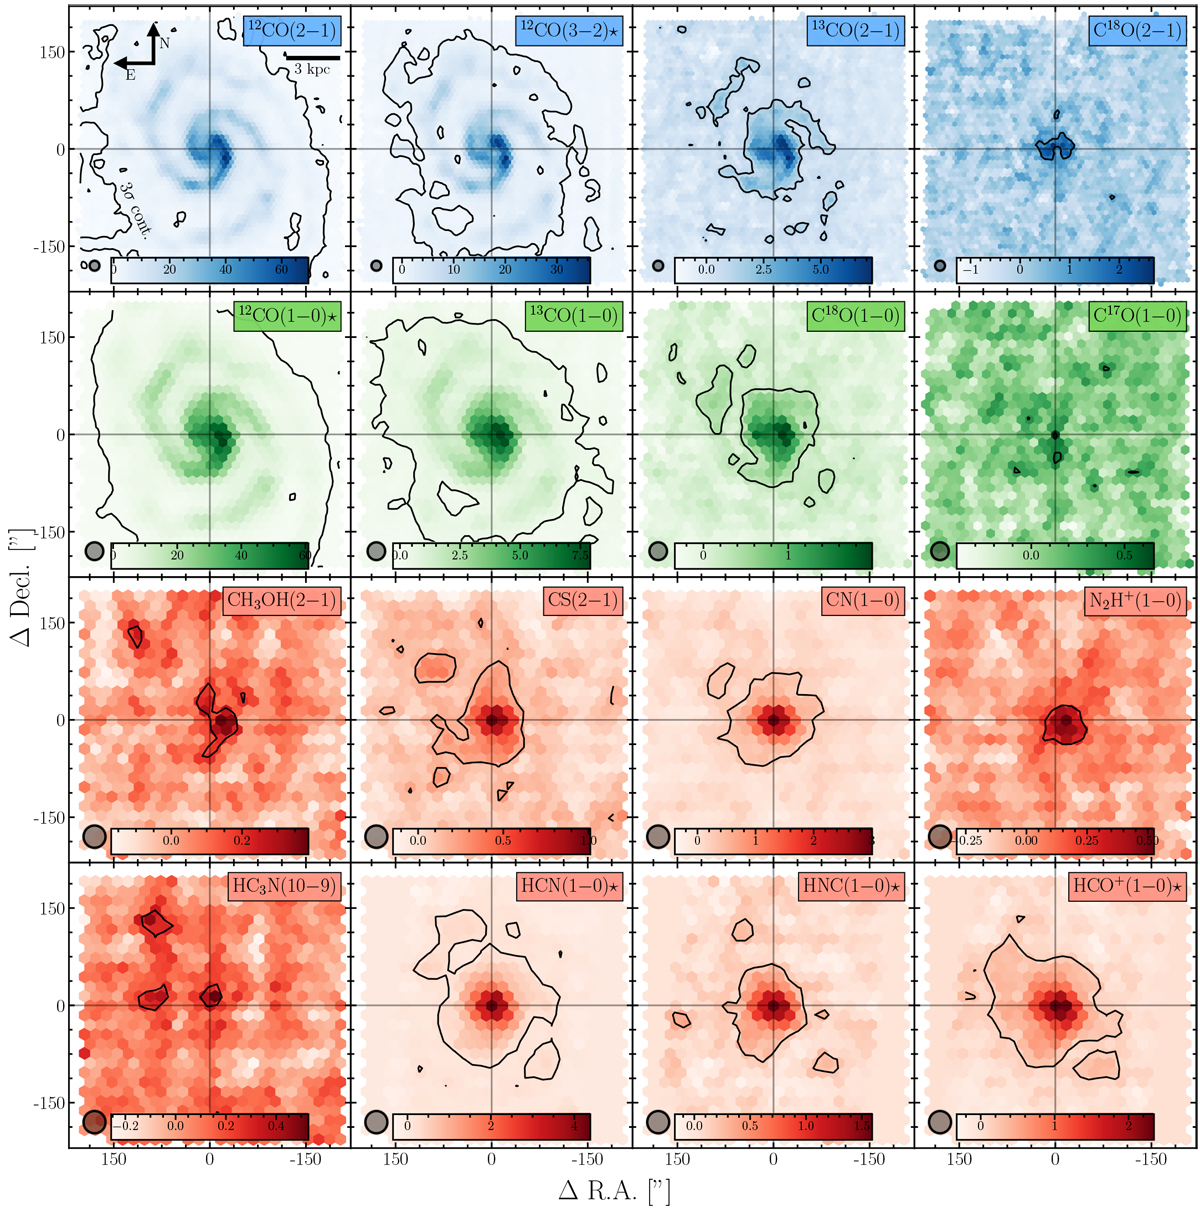
Maps of the velocity-integrated brightness temperature for all lines used in this study. The maps are convolved to certain common beam sizes and re-gridded onto a common hexagonal grid, which allows a more uniform sampling. The top row (blue) is at 15 arcsec resolution, the second row (green) at 27 arcsec, and the remaining two rows (red) are convolved to 34 arcsec (corresponding to 0.62,1.1, and 1.4kpc, respectively). The grid spacing is chosen to be half the beam size. The velocity-integrated brightness temperature is in units of K km s–1. The coordinates are relative to the centre coordinates given in Table 1. The black line indicates the S/N = 3 contour. Lines observed by other programmes are indicated by an asterisk after the line name in each panel. 12CO (1–0) is part of the PAWS survey (Schinnerer et al. 2013; Pety et al. 2013), 12CO (3–2) is taken from the NGLS survey (Wilson et al. 2012), and HCN (l–0), HNC (1–0), and HCO+ (1–0) are emission lines obtained by the EMPIRE survey (Jiménez-Donaire et al. 2019).
Current usage metrics show cumulative count of Article Views (full-text article views including HTML views, PDF and ePub downloads, according to the available data) and Abstracts Views on Vision4Press platform.
Data correspond to usage on the plateform after 2015. The current usage metrics is available 48-96 hours after online publication and is updated daily on week days.
Initial download of the metrics may take a while.