Fig. A.2
Download original image
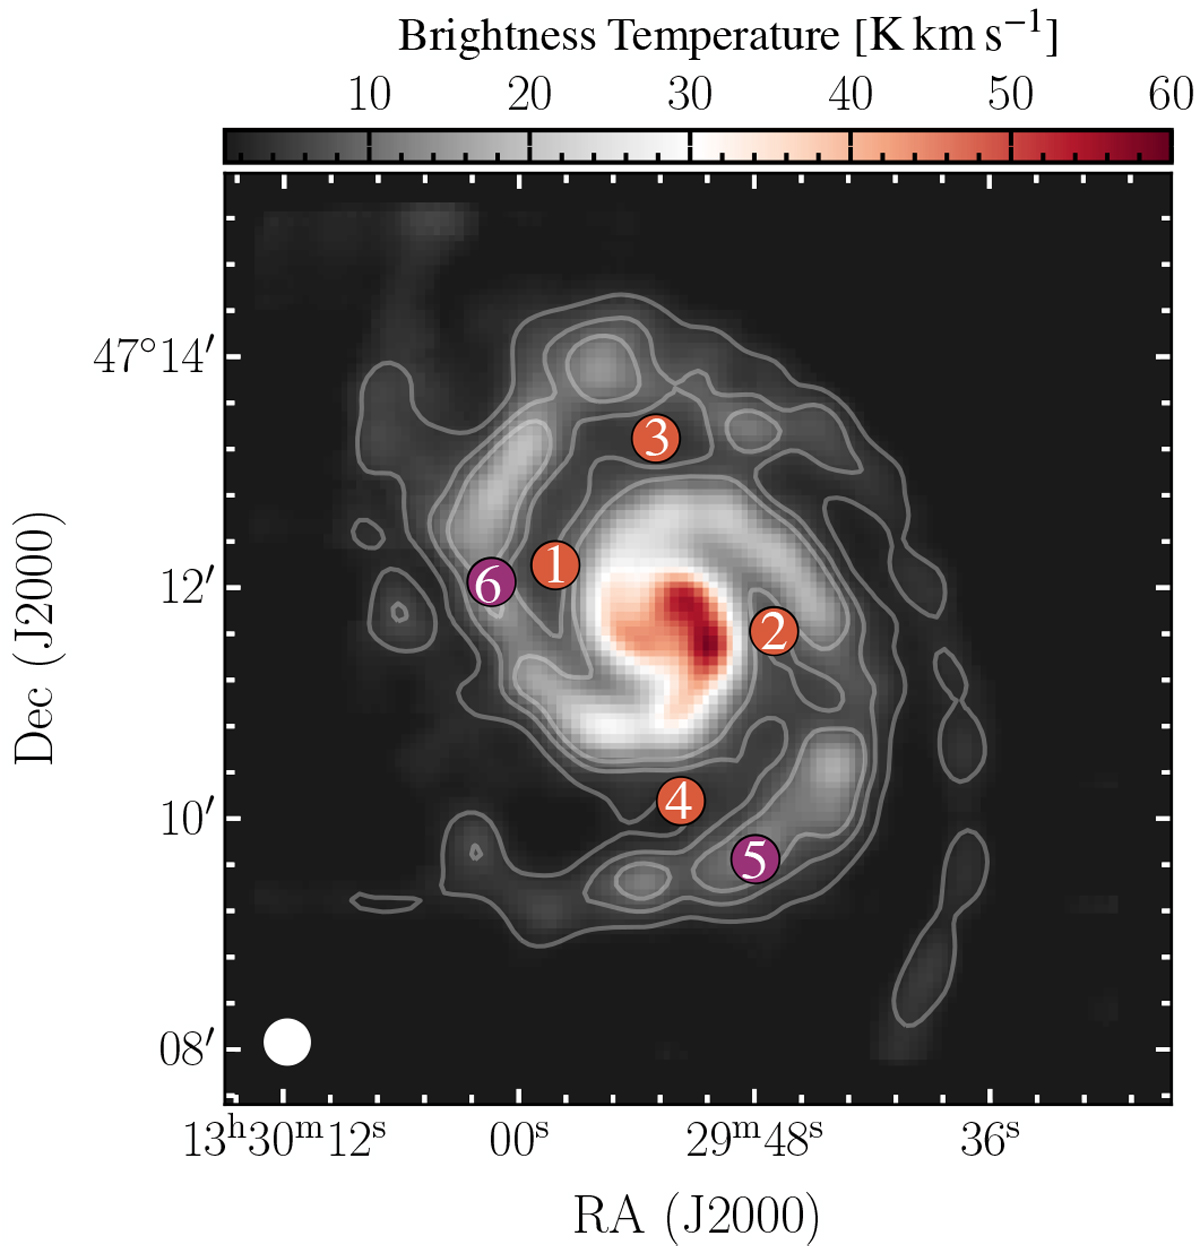
CO (2-1) line brightness temperature map. Indicated are the six pointings for which we performed the error beam correction analysis in Figure A.3. Pointings 1–4 are located in interarm regions (marked in orange). Pointings 5 and 6 are located in spiral arm regions (marked in purple). Contours are drawn at S/N = 10, 20,30. For the IRAM 30 m DDT project E02-20, we observed these six pointings (see Appendix B.1).
Current usage metrics show cumulative count of Article Views (full-text article views including HTML views, PDF and ePub downloads, according to the available data) and Abstracts Views on Vision4Press platform.
Data correspond to usage on the plateform after 2015. The current usage metrics is available 48-96 hours after online publication and is updated daily on week days.
Initial download of the metrics may take a while.