Fig. 17
Download original image
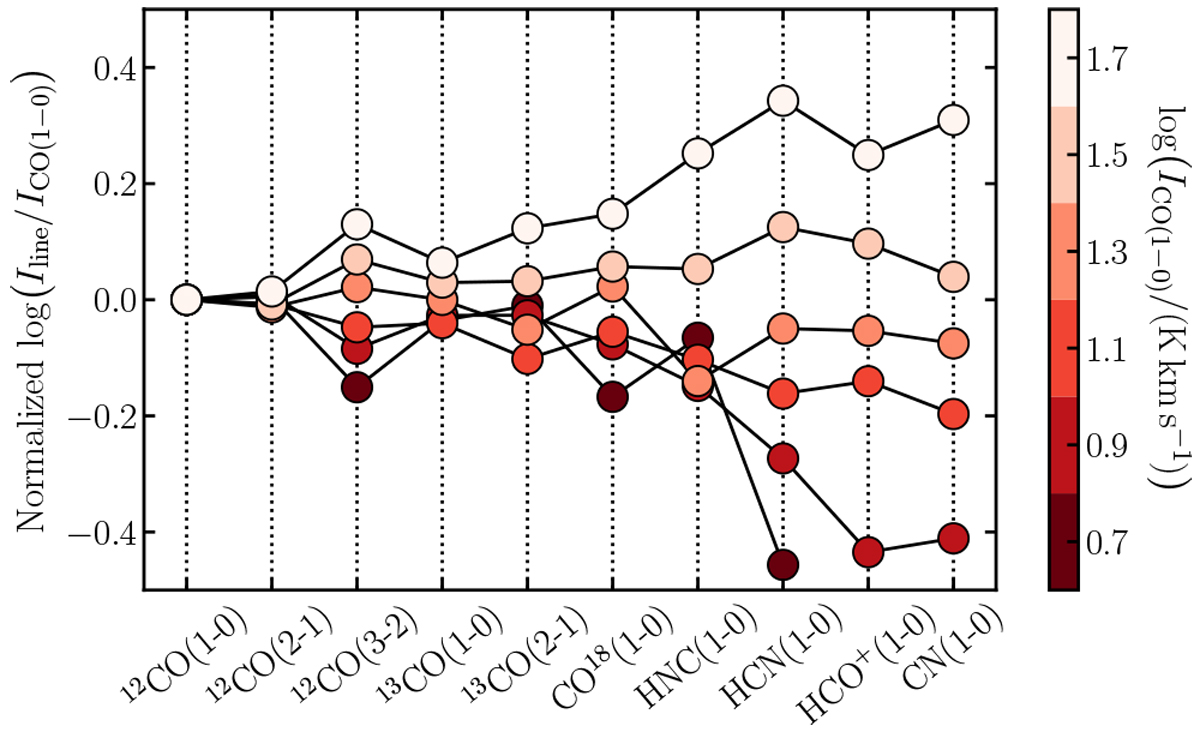
Patterns of molecular line ratios for M 51. Each molecular line is stacked by CO (1–0), and the line ratio is normalised by the mean stacked line ratio with CO (1–0). We colour-coded by the CO (1–0) line brightness of the stacked bin. The line ratios are roughly ordered from left to right by increasing critical density of the line entering in the numerator. We find an increase in the line ratio variations towards the right end of the plot. Such a trend is in agreement with the results from the models presented in Leroy et al. (2017).
Current usage metrics show cumulative count of Article Views (full-text article views including HTML views, PDF and ePub downloads, according to the available data) and Abstracts Views on Vision4Press platform.
Data correspond to usage on the plateform after 2015. The current usage metrics is available 48-96 hours after online publication and is updated daily on week days.
Initial download of the metrics may take a while.