Fig. 16
Download original image
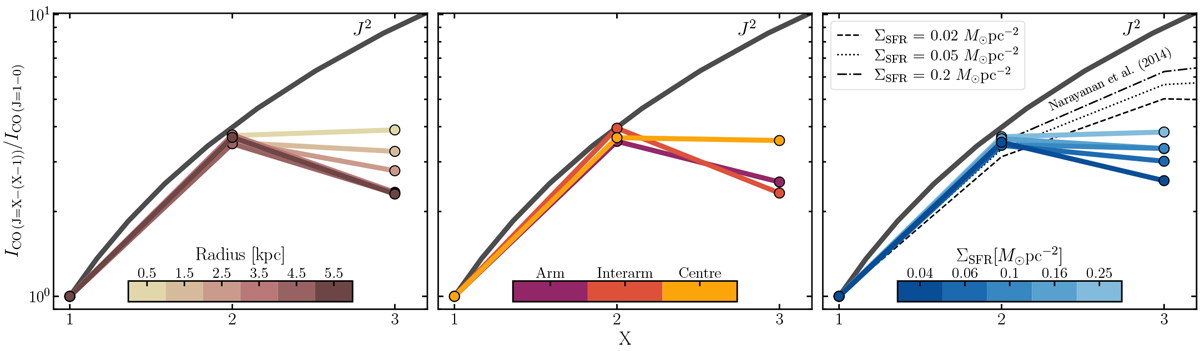
CO SLED variation in M 51. Left: CO SLED binned by 1 kpc radial bins ranging up to 6 kpc. With the exception of the most central 1 kpc bin, we see that the CO SLED peak is already reached for J = 2 → 1. Middle: Variation with galactic environment. The spiral arm and interarm regions show a similar CO SLED shape. Right: Variation as a function of SFR surface density. We include predictions for ΣSFR = 0.2, 0.05, and 0.02 M⊙pc–2 based on the model code provided in Narayanan & Krumholz (2014). We use their unresolved model, which takes different beam filling factors into account for the three CO transitions. For this analysis, we use the data at a 27 arcsec working resolution.
Current usage metrics show cumulative count of Article Views (full-text article views including HTML views, PDF and ePub downloads, according to the available data) and Abstracts Views on Vision4Press platform.
Data correspond to usage on the plateform after 2015. The current usage metrics is available 48-96 hours after online publication and is updated daily on week days.
Initial download of the metrics may take a while.