Fig. 12
Download original image
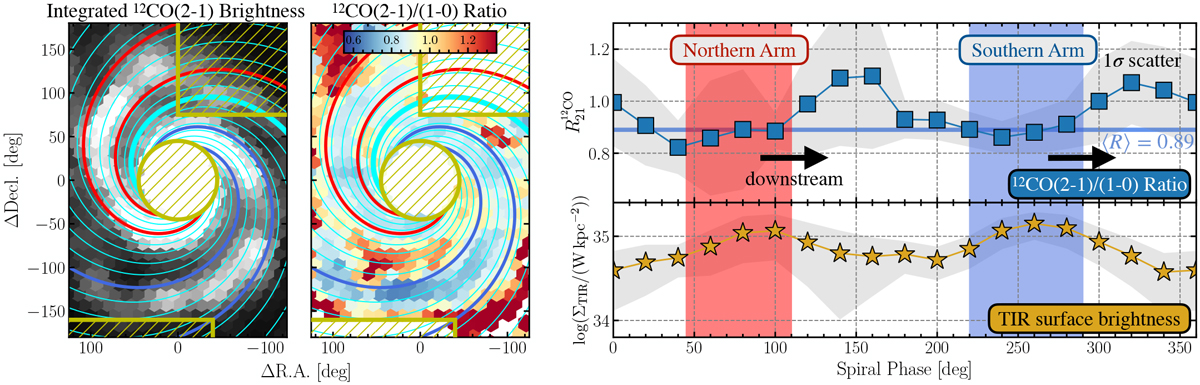
Spiral arm–interarm CO line ratio variation. This figure closely follows the layout of Fig. 4 in Koda et al. (2012). Left: 12CO (2–1) brightness temperature map with the logarithmic spiral pattern. The logarithmic spiral has a pitch angle of 20°. The bold cyan line indicates the starting spiral phase (ψ = 0°). The spiral phases increase anti-clockwise in 20° increments. The red and blue spirals indicate the bounds of the molecular gas spiral arm (at ψ = 45°–110° and 220°–290°). We ignore the top-right and bottom-left regions, where the molecular arm deviates from the logarithmic spiral pattern, in our analysis. Furthermore, we exclude the central region (radius of 45 arcsec, indicated by the yellow hashed region). Centre: 12CO (2–0) line ratio map. We only show sight lines at S/N > 5 and not within the exclusion regions. Right: Average line ratio for each spiral phase bin on top (which has a width of 40° and increases by 20° every step). The blue horizontal line shows the galaxy-wide, luminosity weighted median line ratio of ![]() . The bottom panel shows the TIR surface density (which is proportional to the SFR surface density) to highlight the spiral arm. The grey shaded area indicates the standard deviation. The locations of the northern (red) and southern (blue) spiral arm are indicated. The downstream direction of the spiral arm is indicated by the black arrow.
. The bottom panel shows the TIR surface density (which is proportional to the SFR surface density) to highlight the spiral arm. The grey shaded area indicates the standard deviation. The locations of the northern (red) and southern (blue) spiral arm are indicated. The downstream direction of the spiral arm is indicated by the black arrow.
Current usage metrics show cumulative count of Article Views (full-text article views including HTML views, PDF and ePub downloads, according to the available data) and Abstracts Views on Vision4Press platform.
Data correspond to usage on the plateform after 2015. The current usage metrics is available 48-96 hours after online publication and is updated daily on week days.
Initial download of the metrics may take a while.