Fig. 11
Download original image
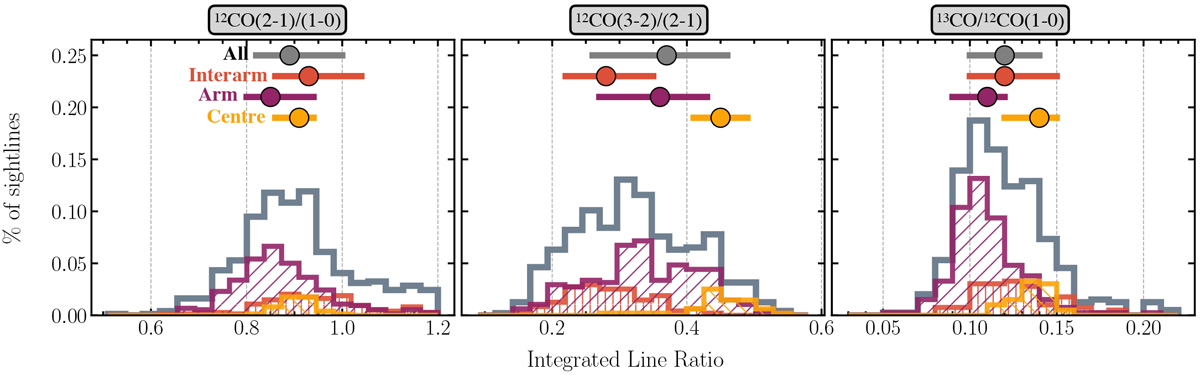
Distributions for three selected CO line ratio in different galactic environments. The locations of the various galactic regions are shown in Fig. 10. For each region, the CO (2–1) brightness temperature weighted median (see Eq. (8)) is indicated by the circle and the 16th and 84th percentile range by the bars. The numerical values are given in Table 4. For the 12CO (2–1)/(1–0) line ratio, we find evidence of larger values in the interarm than in the spiral arm. For 12CO (3–2)/(2–1) we find the opposite trend. 12CO (3–2)/(2–1) and 13CO/12CO (1–0) show a clear enhancement of the line ratio in the galaxy centre.
Current usage metrics show cumulative count of Article Views (full-text article views including HTML views, PDF and ePub downloads, according to the available data) and Abstracts Views on Vision4Press platform.
Data correspond to usage on the plateform after 2015. The current usage metrics is available 48-96 hours after online publication and is updated daily on week days.
Initial download of the metrics may take a while.