Fig. 1
Download original image
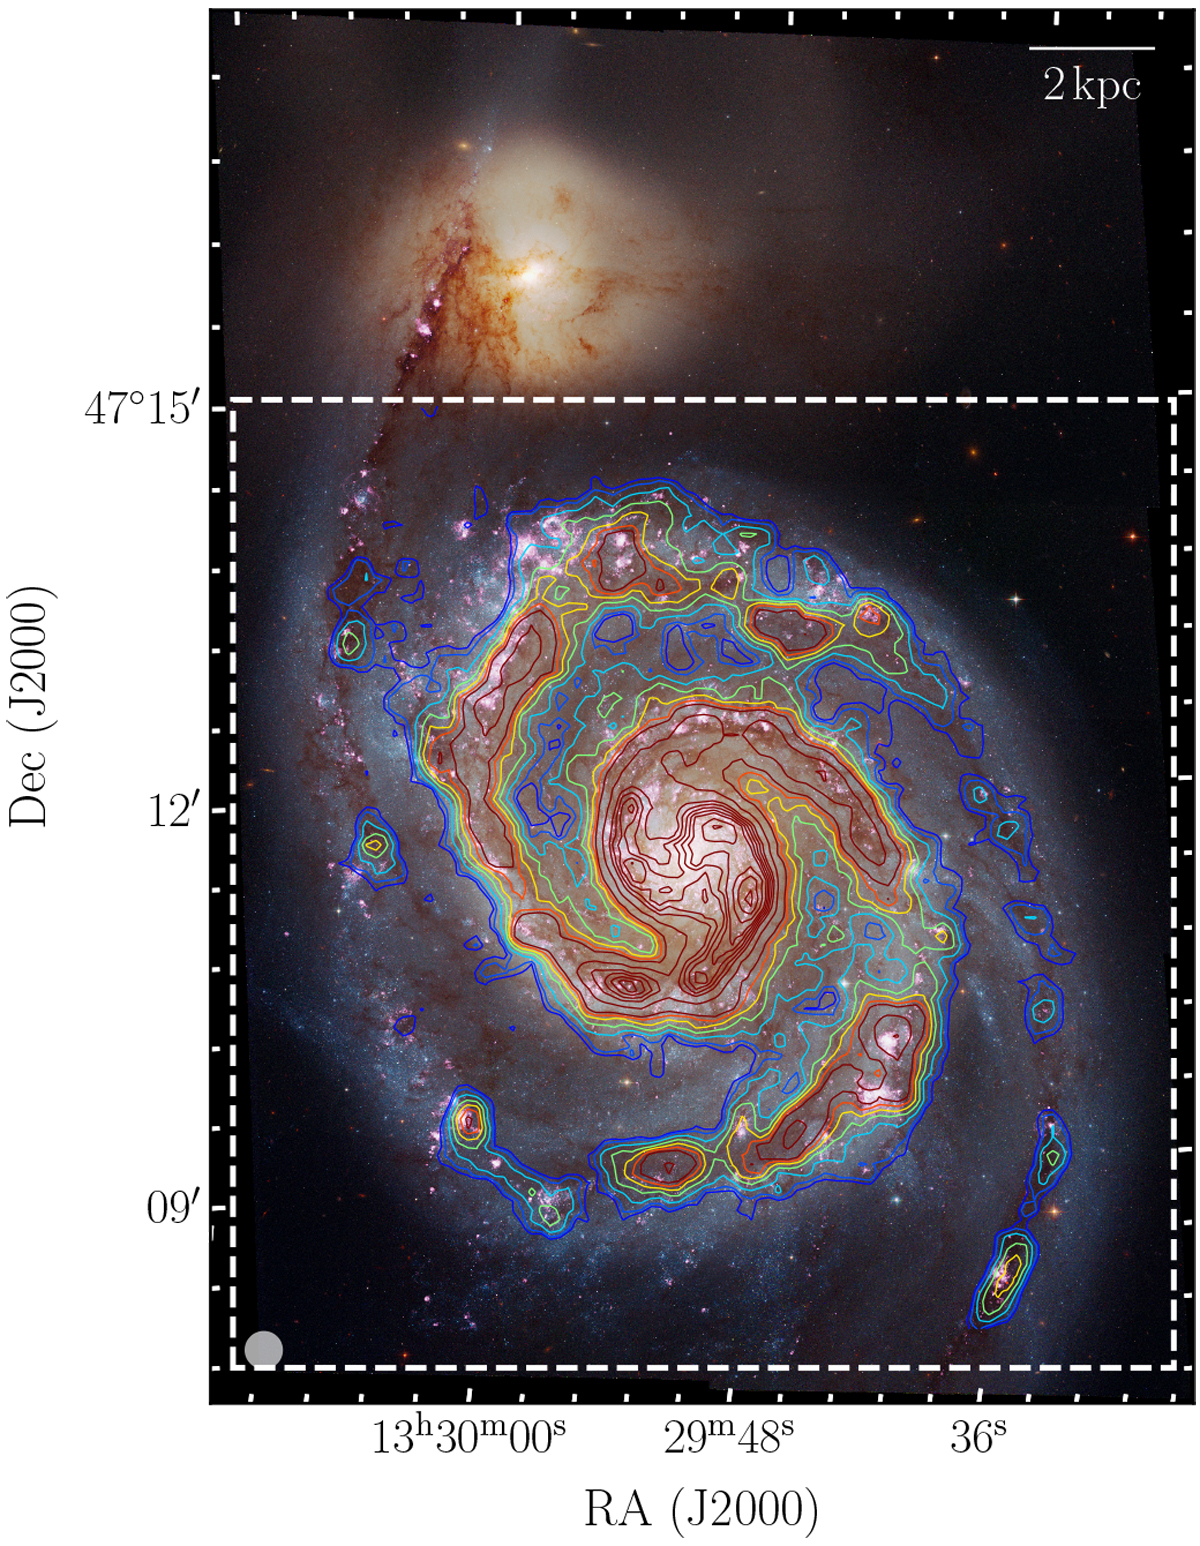
Red, green, and blue (RGB) image of M 51 with 12CO emission, a colour HST plate composed of B, V, and I filter images taken from Mutchler et al. (2005). Overlaid as contours are the IRAM 30 m 12CO (2–1) integrated line brightness temperatures (at a resolution of 13 arcsec, indicated by the circle in the lower-left corner). The contours show signal-to-noise levels from 8 to 70, from blue to brown. The beam size of the 12CO (2–1) observations is indicated at the bottom left of the figure. The dashed region shows the field-of-view of the IRAM 30 m observations.
Current usage metrics show cumulative count of Article Views (full-text article views including HTML views, PDF and ePub downloads, according to the available data) and Abstracts Views on Vision4Press platform.
Data correspond to usage on the plateform after 2015. The current usage metrics is available 48-96 hours after online publication and is updated daily on week days.
Initial download of the metrics may take a while.