Fig. 6.
Download original image
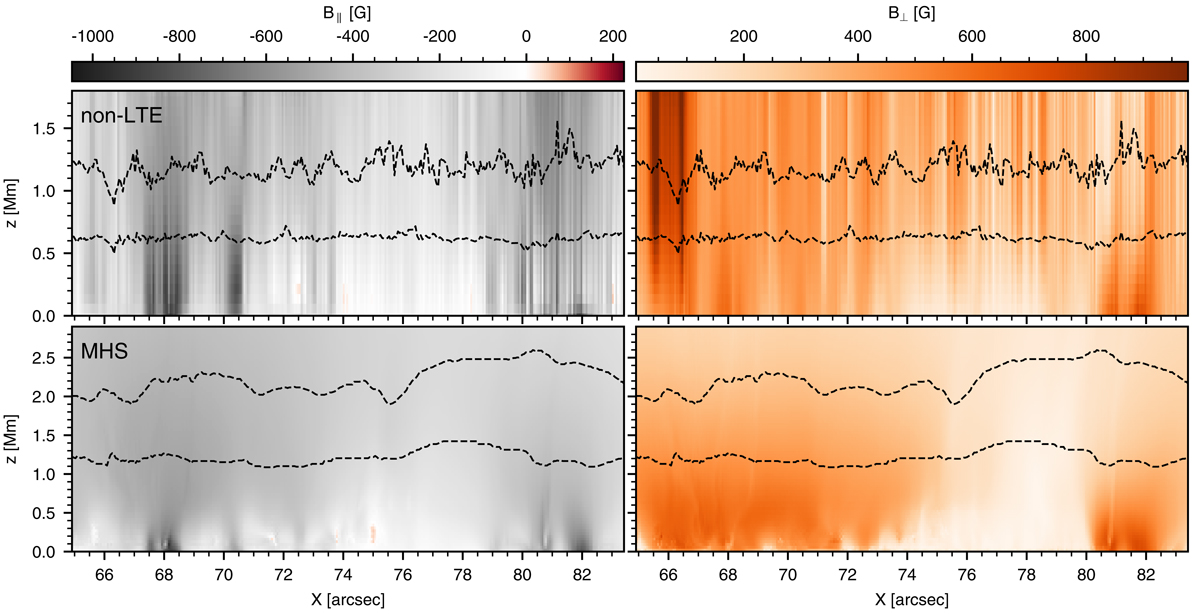
Vertical cuts in B∥ (left column) and B⊥ (right column). The cuts have been taken along the long axis of ROI 1, averaging over the central 5 pixels across that axis. Top row: non-LTE-inferred field. Bottom row: MHS field. The non-LTE and MHS panels have been clipped to the same values according the colour bars at the top of the figure. The dashed lines indicate the heights corresponding to log τ500 = −5.1 (upper line) and −4.1 (lower line) in the upper panels and the equivalent column mass in the MHS model in the lower panels. The lower panels also show the field over a larger z-height range than in the top row.
Current usage metrics show cumulative count of Article Views (full-text article views including HTML views, PDF and ePub downloads, according to the available data) and Abstracts Views on Vision4Press platform.
Data correspond to usage on the plateform after 2015. The current usage metrics is available 48-96 hours after online publication and is updated daily on week days.
Initial download of the metrics may take a while.