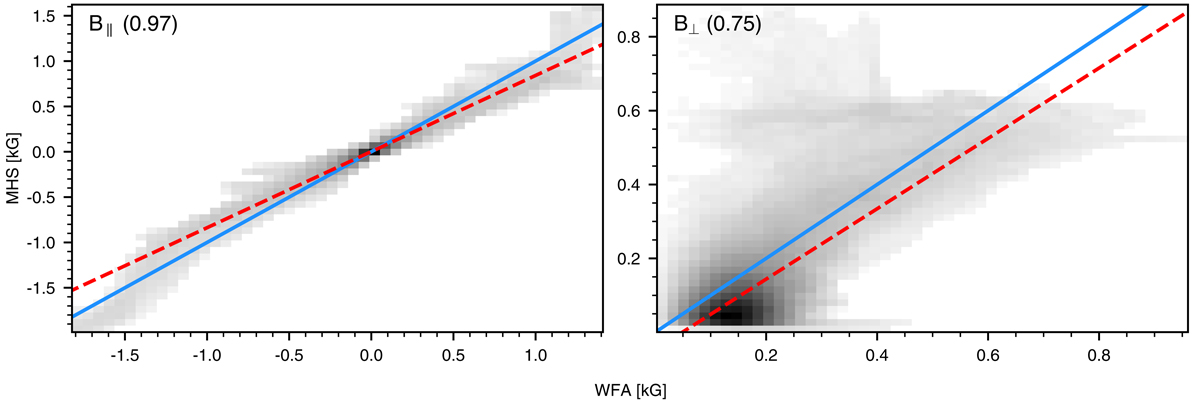
Fig. 3.
Download original image
Two-dimensional histograms of the WFA vs. MHS magnetic field for B∥ (left) and B⊥ (right) for the overlapping part of the FOV shown in Fig. 2 (i.e. excluding pixels without Ca II data). The diagonal blue line indicates a 1:1 relation, and the dashed red line shows a linear fit to the data. The numbers between parantheses indicate the respective Pearson correlation coefficients.
Current usage metrics show cumulative count of Article Views (full-text article views including HTML views, PDF and ePub downloads, according to the available data) and Abstracts Views on Vision4Press platform.
Data correspond to usage on the plateform after 2015. The current usage metrics is available 48-96 hours after online publication and is updated daily on week days.
Initial download of the metrics may take a while.