Fig. 8
Download original image
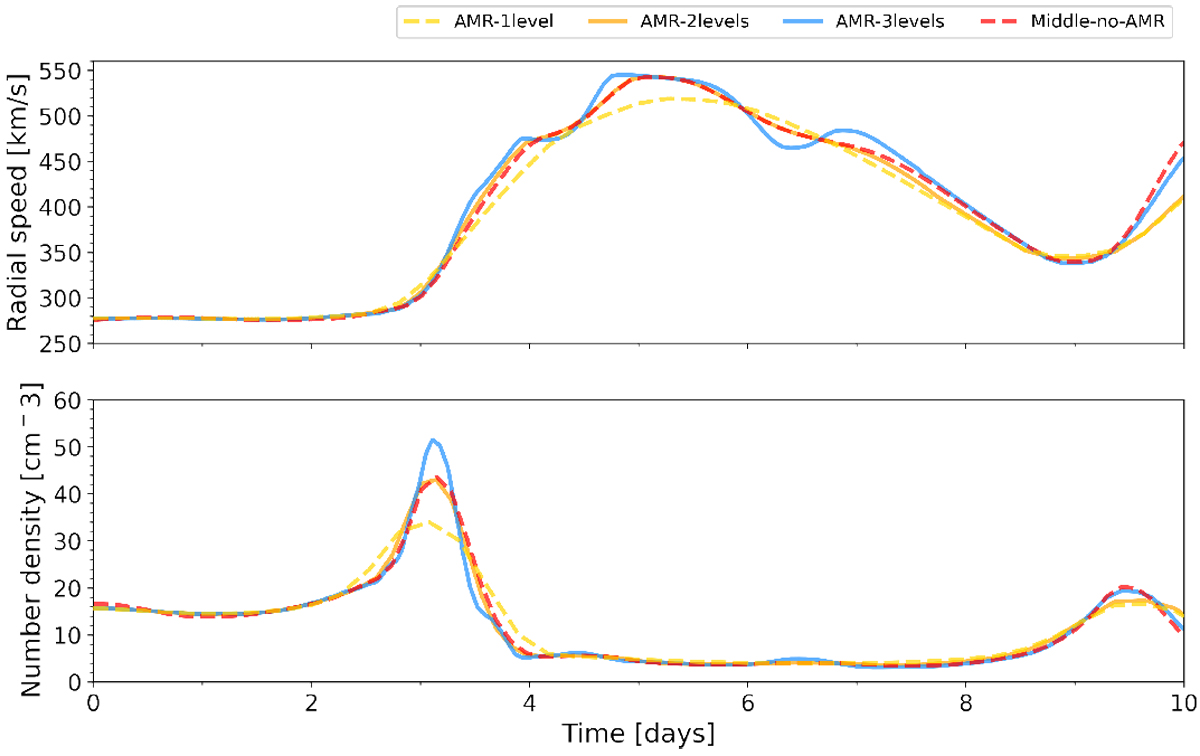
Radial velocity and number density at Earth vs. time for the realistic solar wind (i.e., based on the boundary conditions) determined from the photospheric magnetogram and the semi-empirical WSA-like coronal model of EUHFORIA. Results for middle grid resolution and 1, 2, and 3 AMR levels are shown in dashed red, dashed yellow, orange, and blue, respectively. The dashed yellow curve with only 1 AMR level corresponds to the low resolution run. The x-axis corresponds to the days passed since the end of the relaxation phase (14 days into the simulation).
Current usage metrics show cumulative count of Article Views (full-text article views including HTML views, PDF and ePub downloads, according to the available data) and Abstracts Views on Vision4Press platform.
Data correspond to usage on the plateform after 2015. The current usage metrics is available 48-96 hours after online publication and is updated daily on week days.
Initial download of the metrics may take a while.