Fig. 7
Download original image
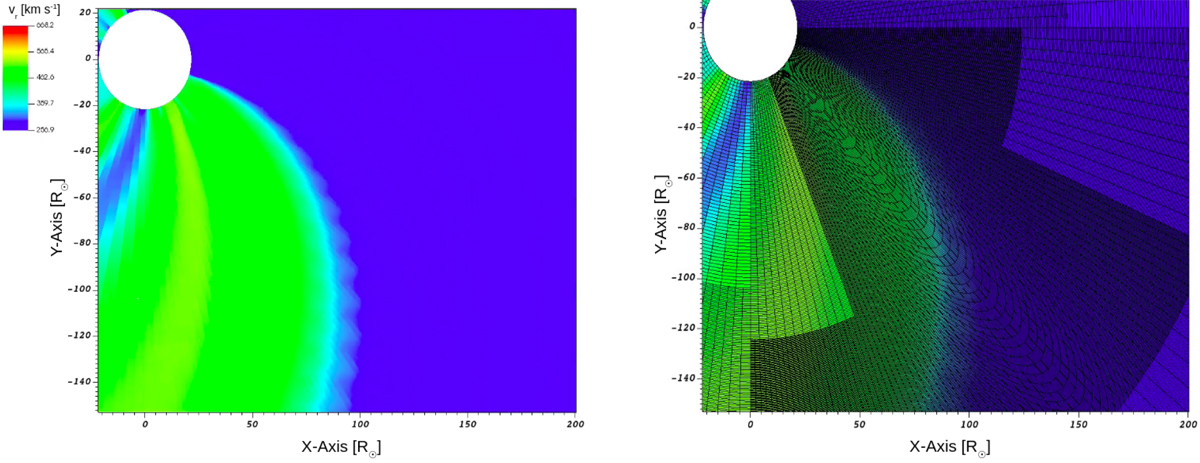
Simulation run with solution AMR limited to three grid levels applied to a single CIR region. The x- and y-axes are shown in R⊙. Both figures are zoomed-in versions of the ecliptic plane, showing the radial speed values. The right panel displays the mesh grid resolution at the different AMR levels in addition to the radial speed.
Current usage metrics show cumulative count of Article Views (full-text article views including HTML views, PDF and ePub downloads, according to the available data) and Abstracts Views on Vision4Press platform.
Data correspond to usage on the plateform after 2015. The current usage metrics is available 48-96 hours after online publication and is updated daily on week days.
Initial download of the metrics may take a while.