Fig. 11
Download original image
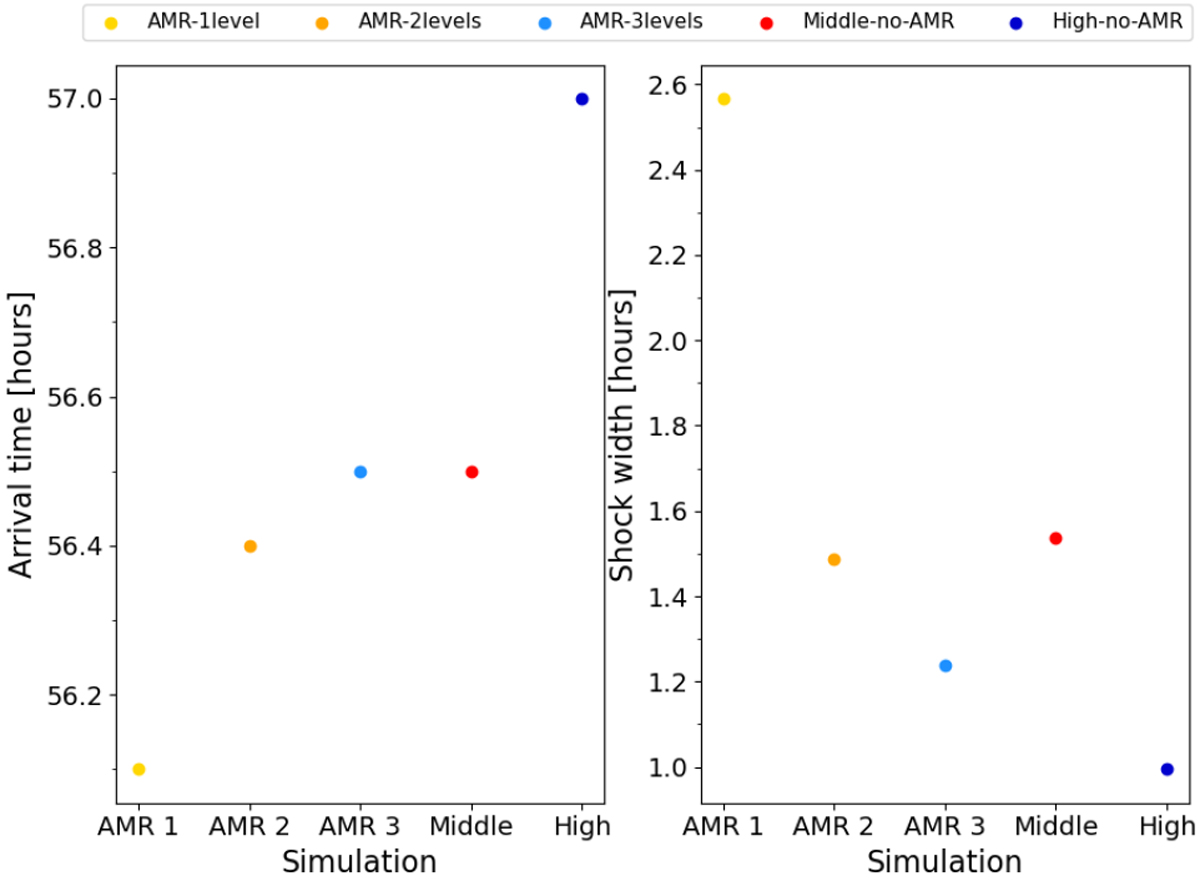
Left panel: arrival time of the CME shock in hours. Right panel: shock width in hours. We show level 1 (no-AMR), level 2 and level 3 results in yellow, orange and blue, respectively. The red and darkblue points show the results for the no-AMR middle and high resolution simulations, respectively. The x-axis shows the corresponding AMR levels (level 1 corresponds to the case without AMR).
Current usage metrics show cumulative count of Article Views (full-text article views including HTML views, PDF and ePub downloads, according to the available data) and Abstracts Views on Vision4Press platform.
Data correspond to usage on the plateform after 2015. The current usage metrics is available 48-96 hours after online publication and is updated daily on week days.
Initial download of the metrics may take a while.