Fig. 10
Download original image
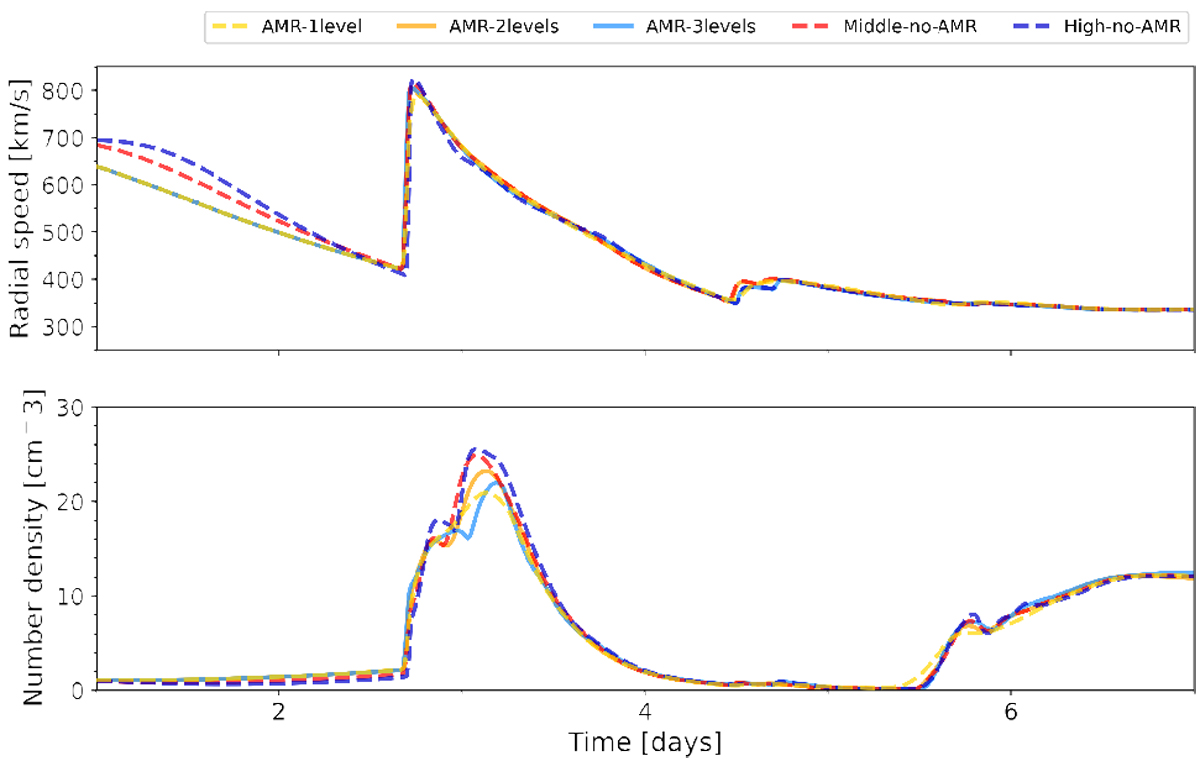
Radial velocity and number density at Earth vs. time. Simulation run is performed with the synthetic wind from Sect. 3.1.1 and the CME parameters as given in Sect. 3.2. As a reference, results for low, middle and high resolution are given by the dashed lines in yellow, red and darkblue. Solution AMR runs with 2 and 3 levels are given by the orange and blue curves, respectively. The x-axis corresponds to the days passed since the end of the relaxation phase (14 days into the simulation). We note that compared to previous figures, we have zoomed in to show days 1 through 7 only.
Current usage metrics show cumulative count of Article Views (full-text article views including HTML views, PDF and ePub downloads, according to the available data) and Abstracts Views on Vision4Press platform.
Data correspond to usage on the plateform after 2015. The current usage metrics is available 48-96 hours after online publication and is updated daily on week days.
Initial download of the metrics may take a while.