Fig. A.1
Download original image
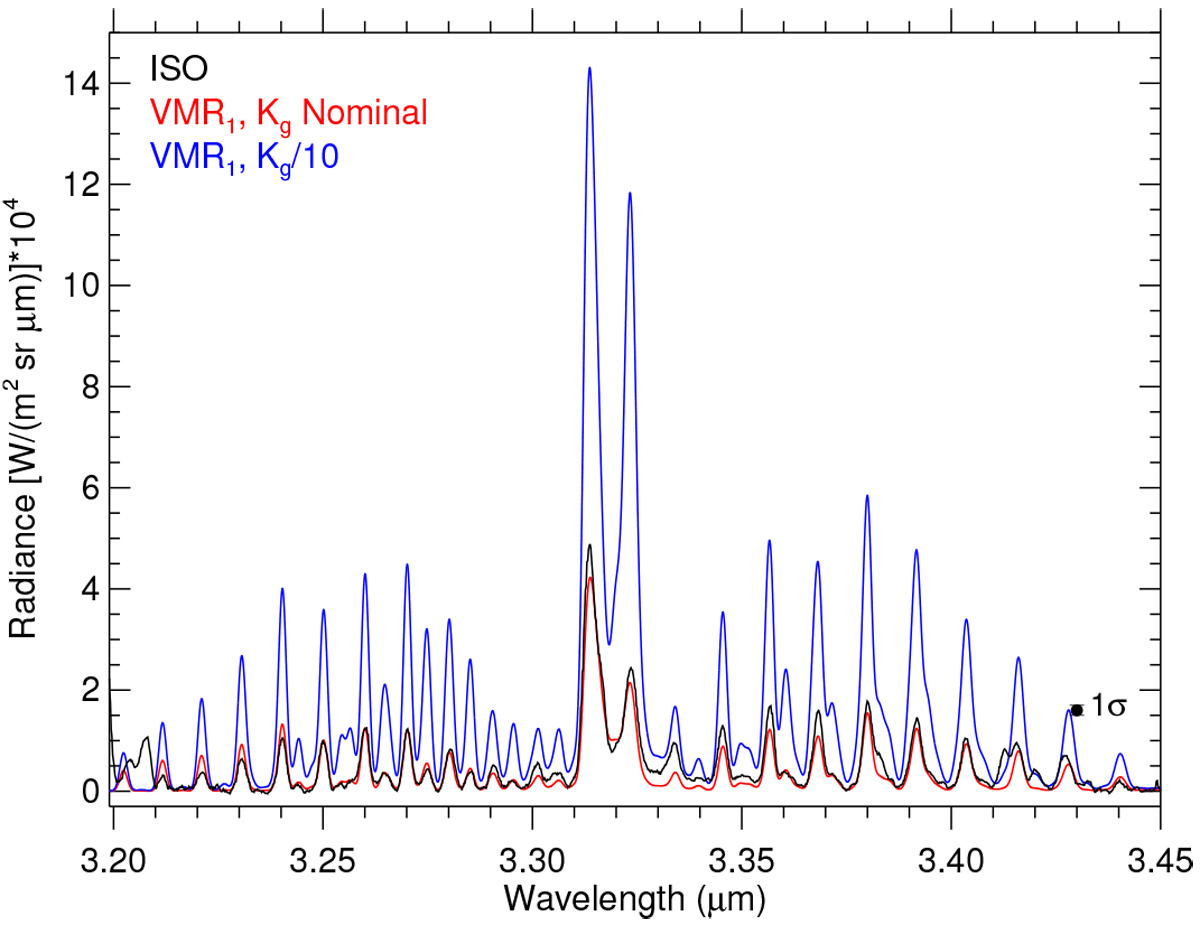
Effects of using a kg rate ten times lower than in Table 1. Shown are the measured (black) and synthetic (red and blue) spectra. The red spectrum assumes the p-T1 and VMR1 profiles and the kq rate in Table 1. The blue spectrum was obtained assuming a collisional rate kg that is times smaller. The 1σ noise error of the measurements is also shown.
Current usage metrics show cumulative count of Article Views (full-text article views including HTML views, PDF and ePub downloads, according to the available data) and Abstracts Views on Vision4Press platform.
Data correspond to usage on the plateform after 2015. The current usage metrics is available 48-96 hours after online publication and is updated daily on week days.
Initial download of the metrics may take a while.