Fig. 15
Download original image
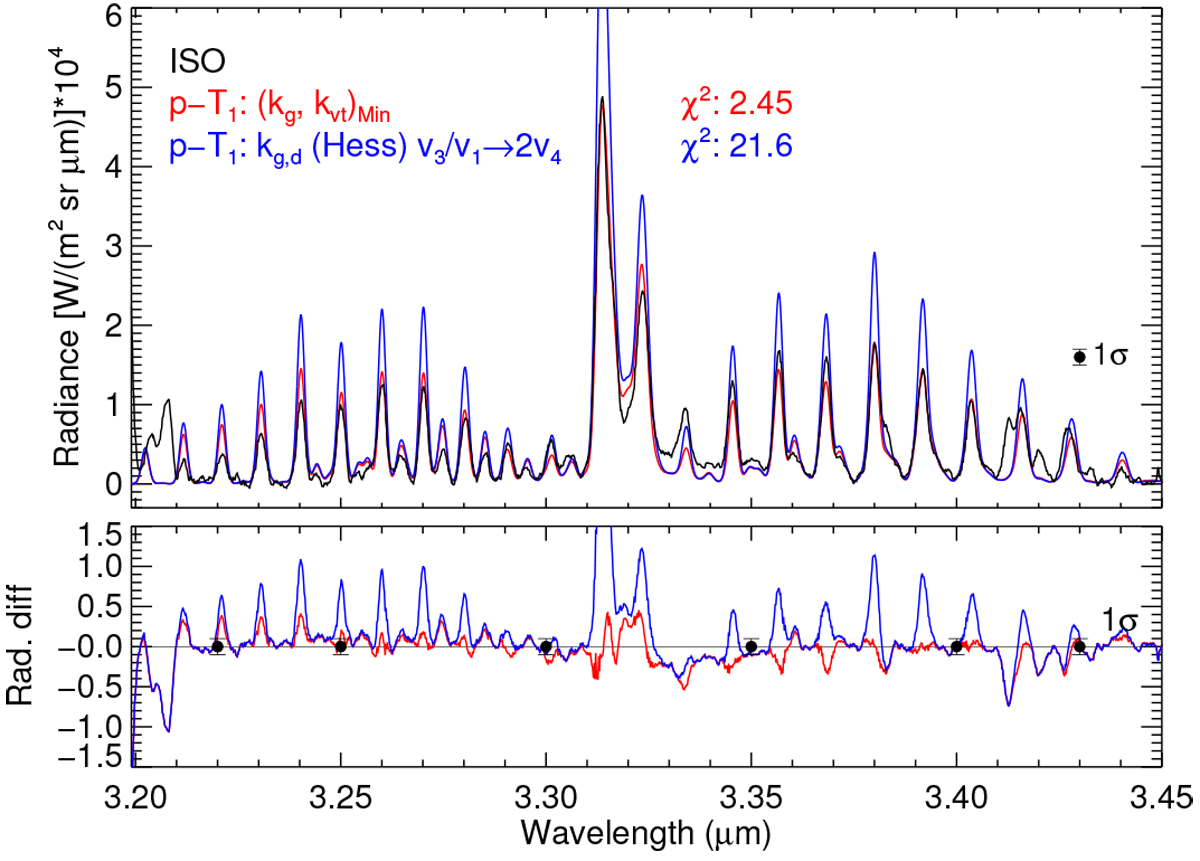
Measured (black) and synthetic (red and blue) spectra. The red spectrum assumed the p-T1 and ![]() profiles and the kg,Min and kvt,Min rates. The blue spectrum is obtained assuming the collisional rate kg,d instead of kg,c (see Table 1 ) and also including the relaxation of v1 by the same process. The 1σ noise error of the measurements is also shown.
profiles and the kg,Min and kvt,Min rates. The blue spectrum is obtained assuming the collisional rate kg,d instead of kg,c (see Table 1 ) and also including the relaxation of v1 by the same process. The 1σ noise error of the measurements is also shown.
Current usage metrics show cumulative count of Article Views (full-text article views including HTML views, PDF and ePub downloads, according to the available data) and Abstracts Views on Vision4Press platform.
Data correspond to usage on the plateform after 2015. The current usage metrics is available 48-96 hours after online publication and is updated daily on week days.
Initial download of the metrics may take a while.