Fig. 14
Download original image
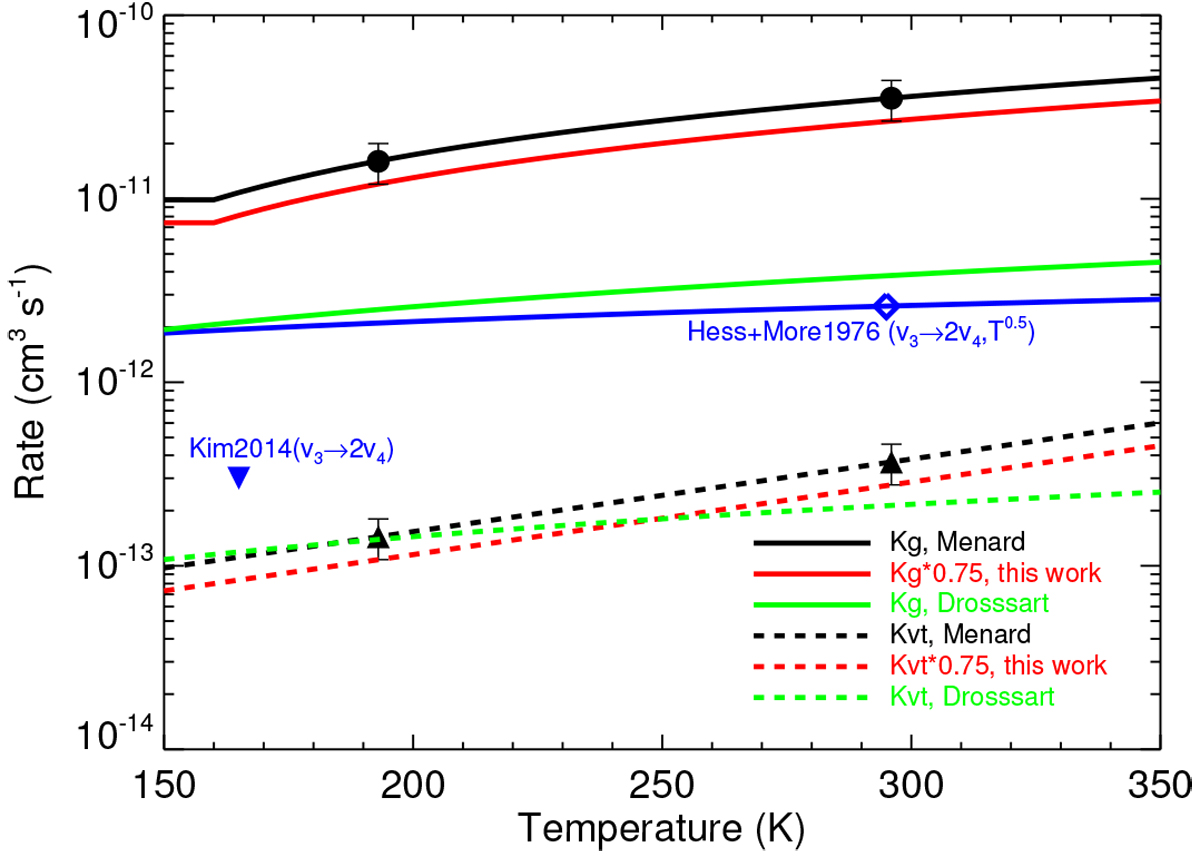
Collisional rates for the deactivation of the v3 state, k4g,c or kg,d (solid curves), and for the relaxation of the v4 state, kvt (dashed curves). The rates measured in the laboratory by Menard-Bourcin et al. (2005) are shown with solid circles and triangles, in black, with their respective errors. The rates derived in Drossart et al. (1999) are shown with green curves. The kvt rate measured by Hess & Moore (1976) (blue open diamond) was used in Kim et al. (2014) with a ![]() -dependence and is indicated by the blue curve. The upper limit of the kg rate used by Kim et al. (2014) to derive their lower limit model D for the CH4 abundance is represented with a filled downward triangle in blue. The rates derived in this work are shown in red.
-dependence and is indicated by the blue curve. The upper limit of the kg rate used by Kim et al. (2014) to derive their lower limit model D for the CH4 abundance is represented with a filled downward triangle in blue. The rates derived in this work are shown in red.
Current usage metrics show cumulative count of Article Views (full-text article views including HTML views, PDF and ePub downloads, according to the available data) and Abstracts Views on Vision4Press platform.
Data correspond to usage on the plateform after 2015. The current usage metrics is available 48-96 hours after online publication and is updated daily on week days.
Initial download of the metrics may take a while.