Fig. 13
Download original image
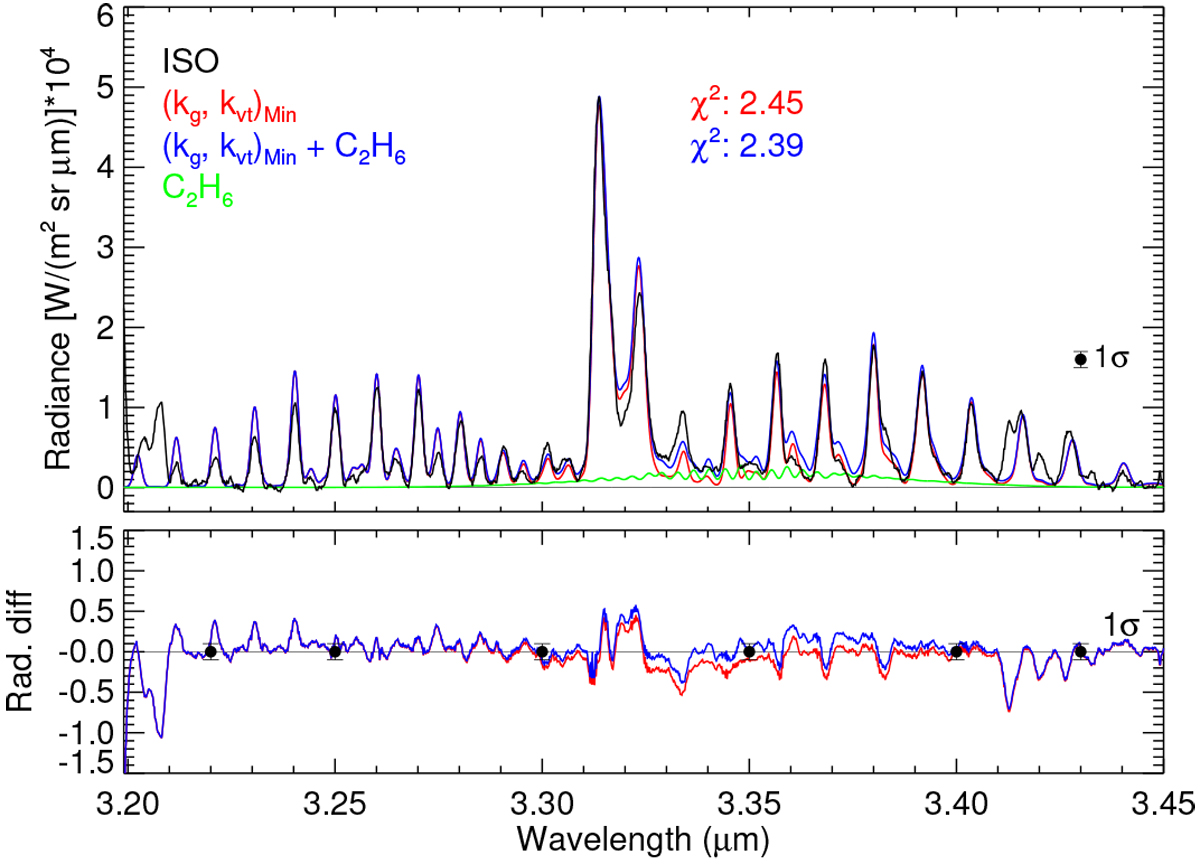
Measured spectrum (black); model radiance using the p-T1, the ![]() profile and the lower limit kg,Min and kvt,Min rates (red); estimated contribution of C2H6 (green); and sum of both contributions (blue). The 1σ noise error of the measurements is also shown. The combined model fits slightly better the measurements (smaller χ2) as observed in the differences.
profile and the lower limit kg,Min and kvt,Min rates (red); estimated contribution of C2H6 (green); and sum of both contributions (blue). The 1σ noise error of the measurements is also shown. The combined model fits slightly better the measurements (smaller χ2) as observed in the differences.
Current usage metrics show cumulative count of Article Views (full-text article views including HTML views, PDF and ePub downloads, according to the available data) and Abstracts Views on Vision4Press platform.
Data correspond to usage on the plateform after 2015. The current usage metrics is available 48-96 hours after online publication and is updated daily on week days.
Initial download of the metrics may take a while.