Fig. 12
Download original image
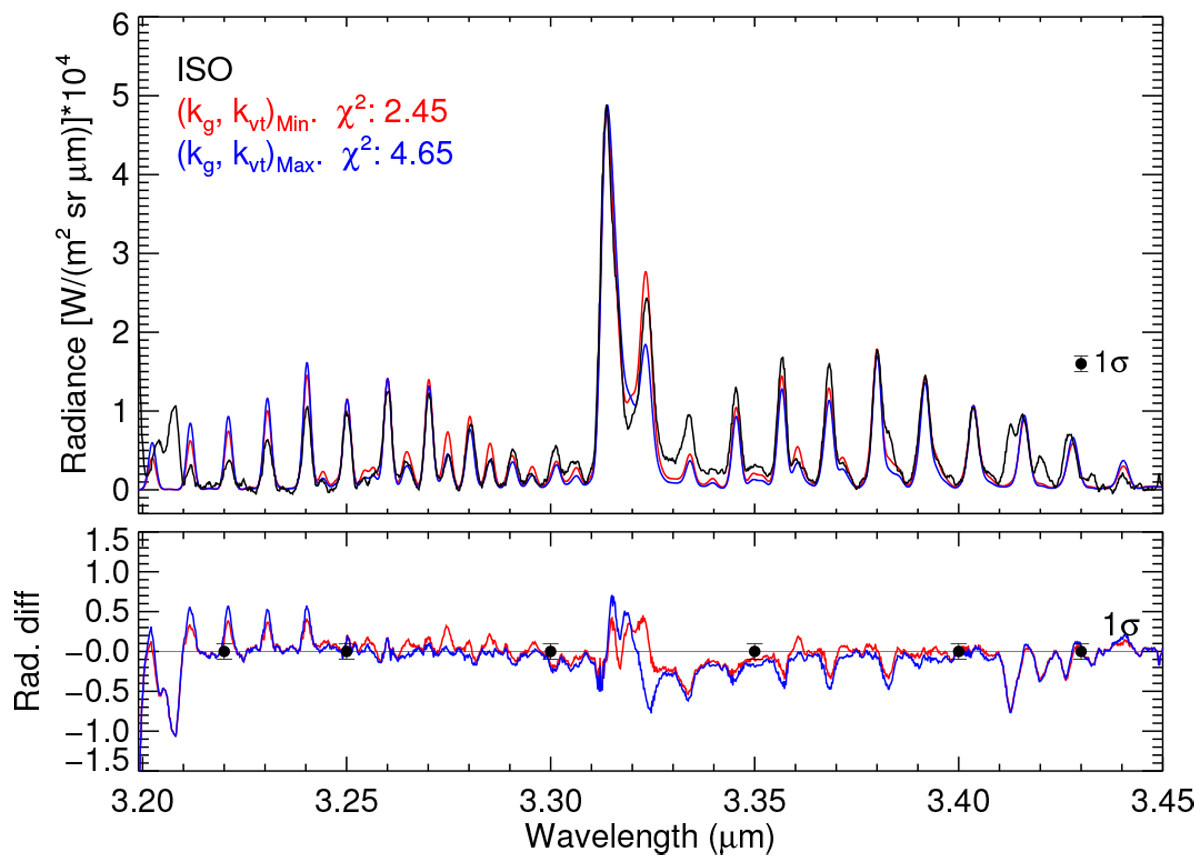
Effects of perturbing the nominal kg and kvt rate coefficients on the radiance by their errors. The measured spectrum is shown in black; the p-T1 and ![]() profiles were used with the kmin rates for the model in red, and with kmax rates for the blue curve. The 1σ noise error of the measurements is also shown. The relative differences are kept below ~1% in all cases.
profiles were used with the kmin rates for the model in red, and with kmax rates for the blue curve. The 1σ noise error of the measurements is also shown. The relative differences are kept below ~1% in all cases.
Current usage metrics show cumulative count of Article Views (full-text article views including HTML views, PDF and ePub downloads, according to the available data) and Abstracts Views on Vision4Press platform.
Data correspond to usage on the plateform after 2015. The current usage metrics is available 48-96 hours after online publication and is updated daily on week days.
Initial download of the metrics may take a while.