Free Access
Fig. 10
Download original image
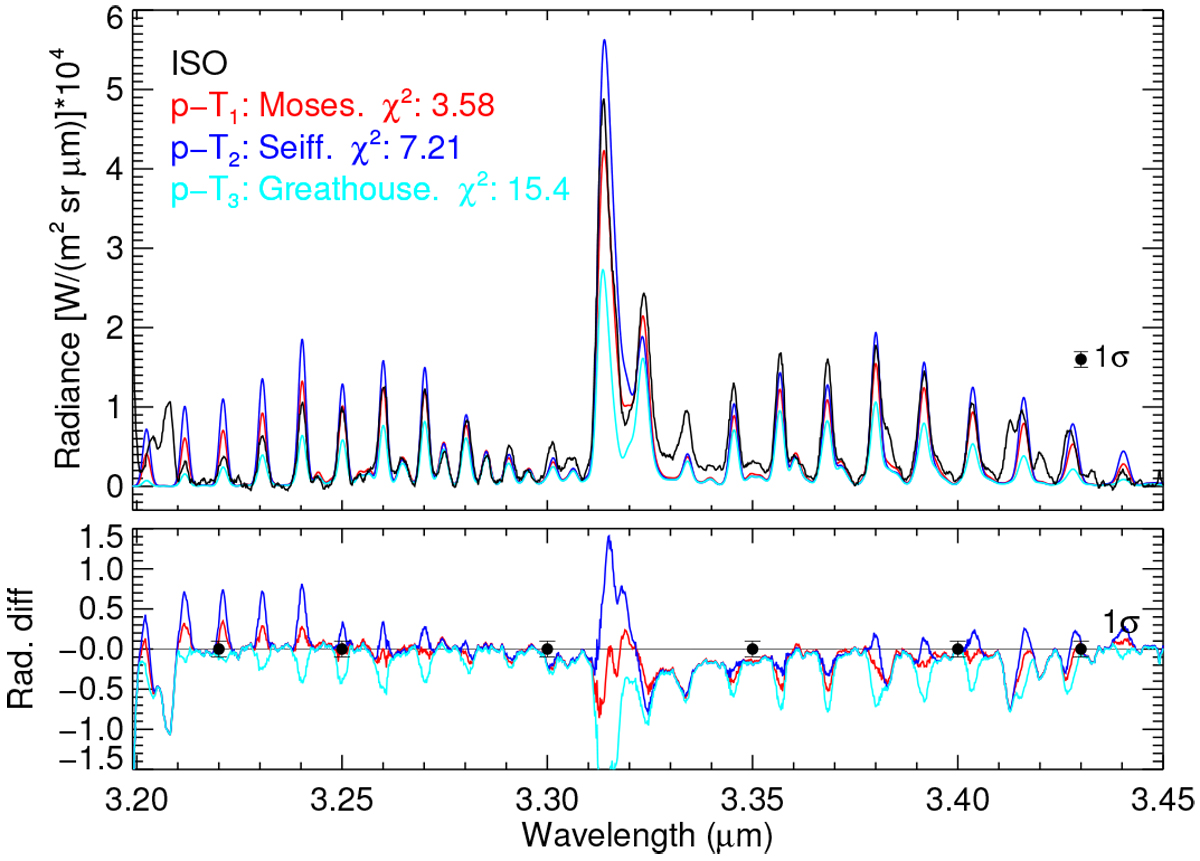
Measured (black) and synthetic (red, p-T1 ; blue, p-T2; cyan, p-T3) spectra. The VMR1 profile and the nominal collisional rates are used. The 1σ noise error of the measurements is also shown. As evidenced by the differences, p-T1 provides the best fit to the observations.
Current usage metrics show cumulative count of Article Views (full-text article views including HTML views, PDF and ePub downloads, according to the available data) and Abstracts Views on Vision4Press platform.
Data correspond to usage on the plateform after 2015. The current usage metrics is available 48-96 hours after online publication and is updated daily on week days.
Initial download of the metrics may take a while.