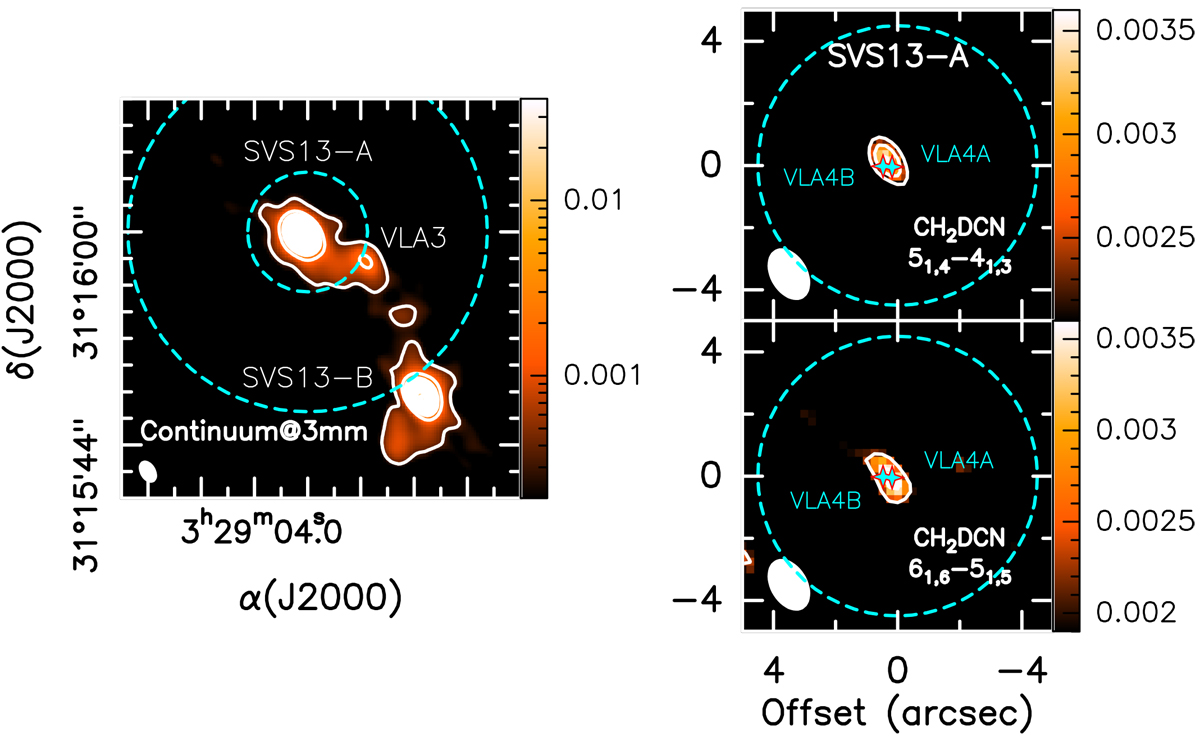
Fig. 1
Download original image
NOEMA/SOLIS images of the continuum and CH2DCN line emission towards SVS13-A. Left panel: dust continuum emission at about 90 GHz (see Sect. 2). The intensity scale is in Jy beam−1. The first contour and the steps are 5σ (1σ = 7 µJybeam−1) and 20σ, respectively. The filled ellipse in the bottom left corner shows the synthesised beam (HPBW): 1″.8 × 1″.2 (PA = 39°). The three objects in the primary beam, SVS13-A, SVS13-B, and VLA3, are labelled. The cyan dashed circles indicate the minimum (9″) and maximum (27″) IRAM-30m HPBW in the 1 and 3 mm bands, respectively (see Sect. 3). Right panels: zoomed-in images of the central region where the two CH2DCN lines emit. The intensity scale is Jy beam−1 kms−1. The first contours and steps are 3σ (2.1 mJy beam−1 km s−1) and 1σ, respectively. The synthesised beam is the same as for the continuum map. The two components of the SVS13-A binary system, VLA4A and VLA4B, are 0″.3 apart (Anglada et al. 2000) and are labelled. The cyan dashed circle shows the 9″ IRAM-30 m HPBW.
Current usage metrics show cumulative count of Article Views (full-text article views including HTML views, PDF and ePub downloads, according to the available data) and Abstracts Views on Vision4Press platform.
Data correspond to usage on the plateform after 2015. The current usage metrics is available 48-96 hours after online publication and is updated daily on week days.
Initial download of the metrics may take a while.