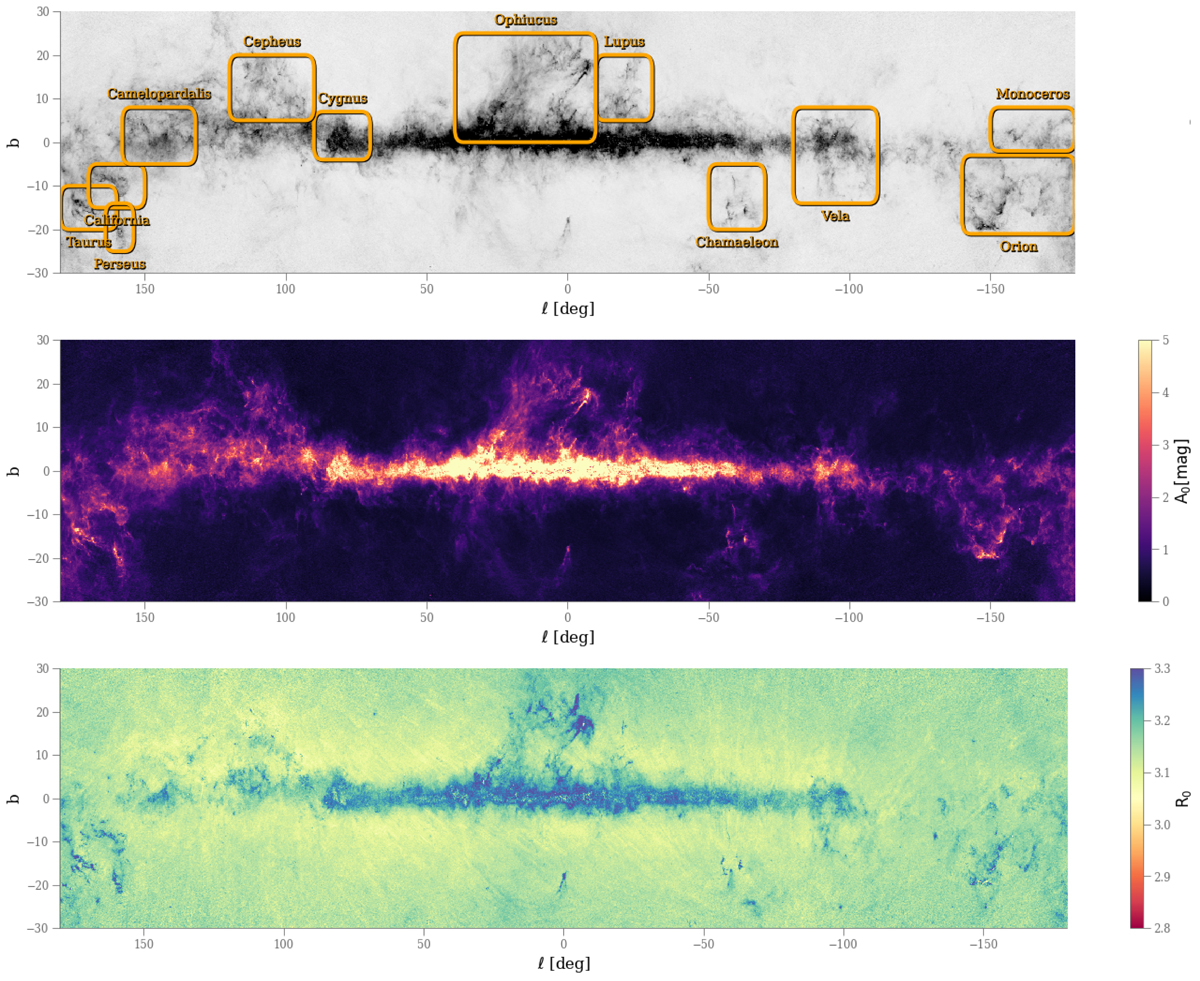
Fig. 9.
Download original image
Sky distribution in Galactic coordinates (averaged over all distances) of the dust extinction parameters A0 (middle) and R0 (bottom). We indicate some molecular regions of our Galaxy by the rectangles in the top panel (overlay of the gray-scaled A0 map). The maps are centered on the Galactic center, with longitudes increasing toward the left. We only plot the 60° centered on the Milky Way disk in these panels. Zoomed-in views of the highlighted regions are shown in Figs. B.4 and B.5.
Current usage metrics show cumulative count of Article Views (full-text article views including HTML views, PDF and ePub downloads, according to the available data) and Abstracts Views on Vision4Press platform.
Data correspond to usage on the plateform after 2015. The current usage metrics is available 48-96 hours after online publication and is updated daily on week days.
Initial download of the metrics may take a while.