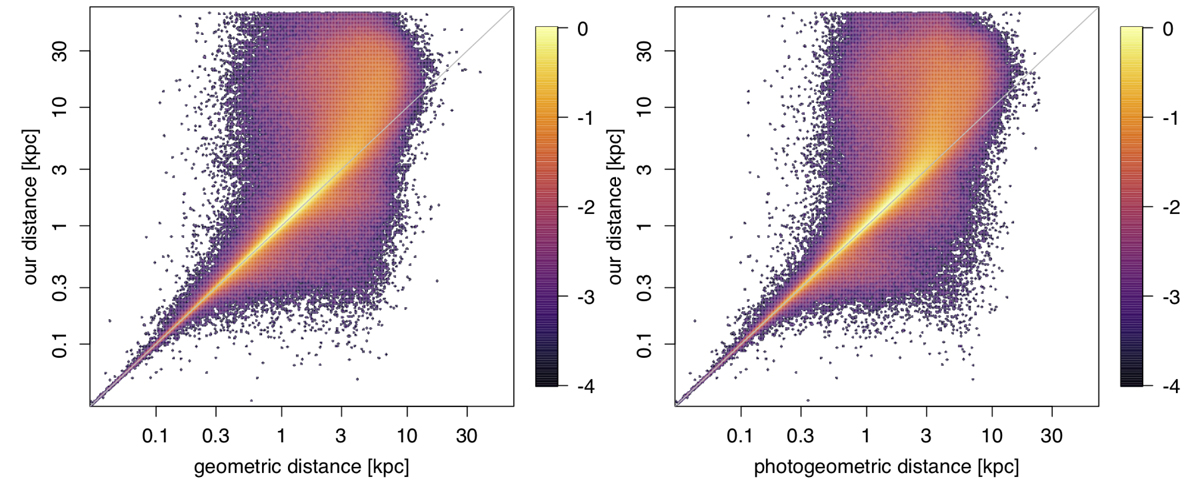
Fig. 7.
Download original image
Comparison of the median distance in our catalog (vertical axis) with the median geometric (left) and median photogeometric (right) distances from the Gaia EDR3-based catalog of Bailer-Jones et al. (2021). The color scale indicates the density of sources in each panel on a log10 scale relative to the maximum. We note the logarithmic distance axes. The diagonal line is the identity line.
Current usage metrics show cumulative count of Article Views (full-text article views including HTML views, PDF and ePub downloads, according to the available data) and Abstracts Views on Vision4Press platform.
Data correspond to usage on the plateform after 2015. The current usage metrics is available 48-96 hours after online publication and is updated daily on week days.
Initial download of the metrics may take a while.