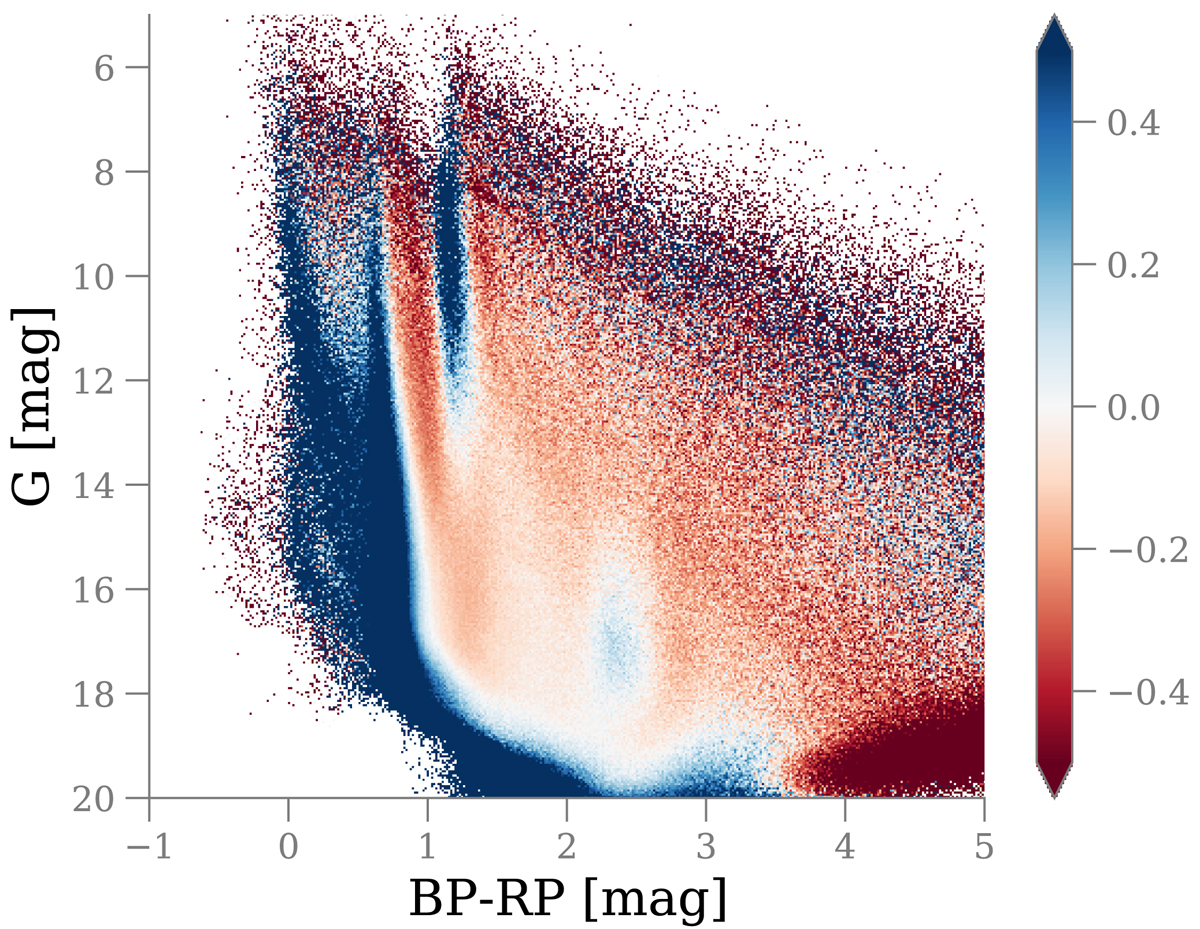
Fig. B.3.

Download original image
Residuals between the observed and inferred CMDs for the 123 076 271 stars of the whole catalog (top panels of Fig. B.1). The residuals are calculated on a 512 x 512 binning scheme (0.01 x 0.03 mag) within the axis ranges and normalized to the predicted counts (i.e., (obs-pred/pred)): red and blue colors indicate overestimated and underestimated counts, respectively. Systematics are discussed in Sect. 4. Stars bluer than what the stellar evolution model predicts pile up in the residuals at BP-RP ∼ 1 mag.
Current usage metrics show cumulative count of Article Views (full-text article views including HTML views, PDF and ePub downloads, according to the available data) and Abstracts Views on Vision4Press platform.
Data correspond to usage on the plateform after 2015. The current usage metrics is available 48-96 hours after online publication and is updated daily on week days.
Initial download of the metrics may take a while.


