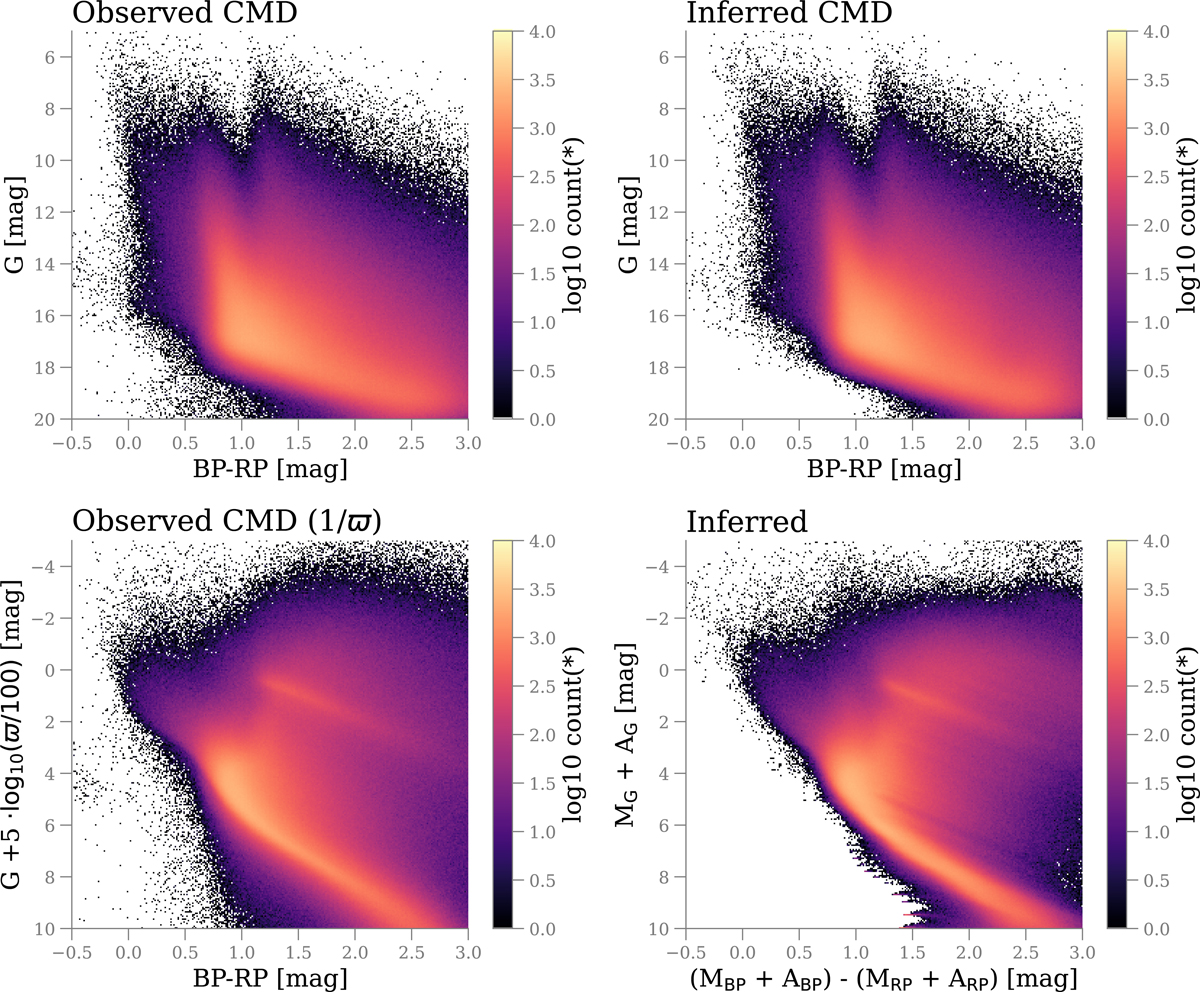
Fig. B.1.
Download original image
Overview of our analysis procedure on the whole catalog, which contains 123 076 271 stars. The top panels present observed CMDs, with the left and right panels showing the input data and their median predictions, respectively. The lower panels show the inverse parallax distance-corrected CMD and the distance corrections obtained from the AP estimates. The quantities on the y axes of these two panels would be identical in the absence of parallax noise.
Current usage metrics show cumulative count of Article Views (full-text article views including HTML views, PDF and ePub downloads, according to the available data) and Abstracts Views on Vision4Press platform.
Data correspond to usage on the plateform after 2015. The current usage metrics is available 48-96 hours after online publication and is updated daily on week days.
Initial download of the metrics may take a while.