Open Access
Fig. 15.
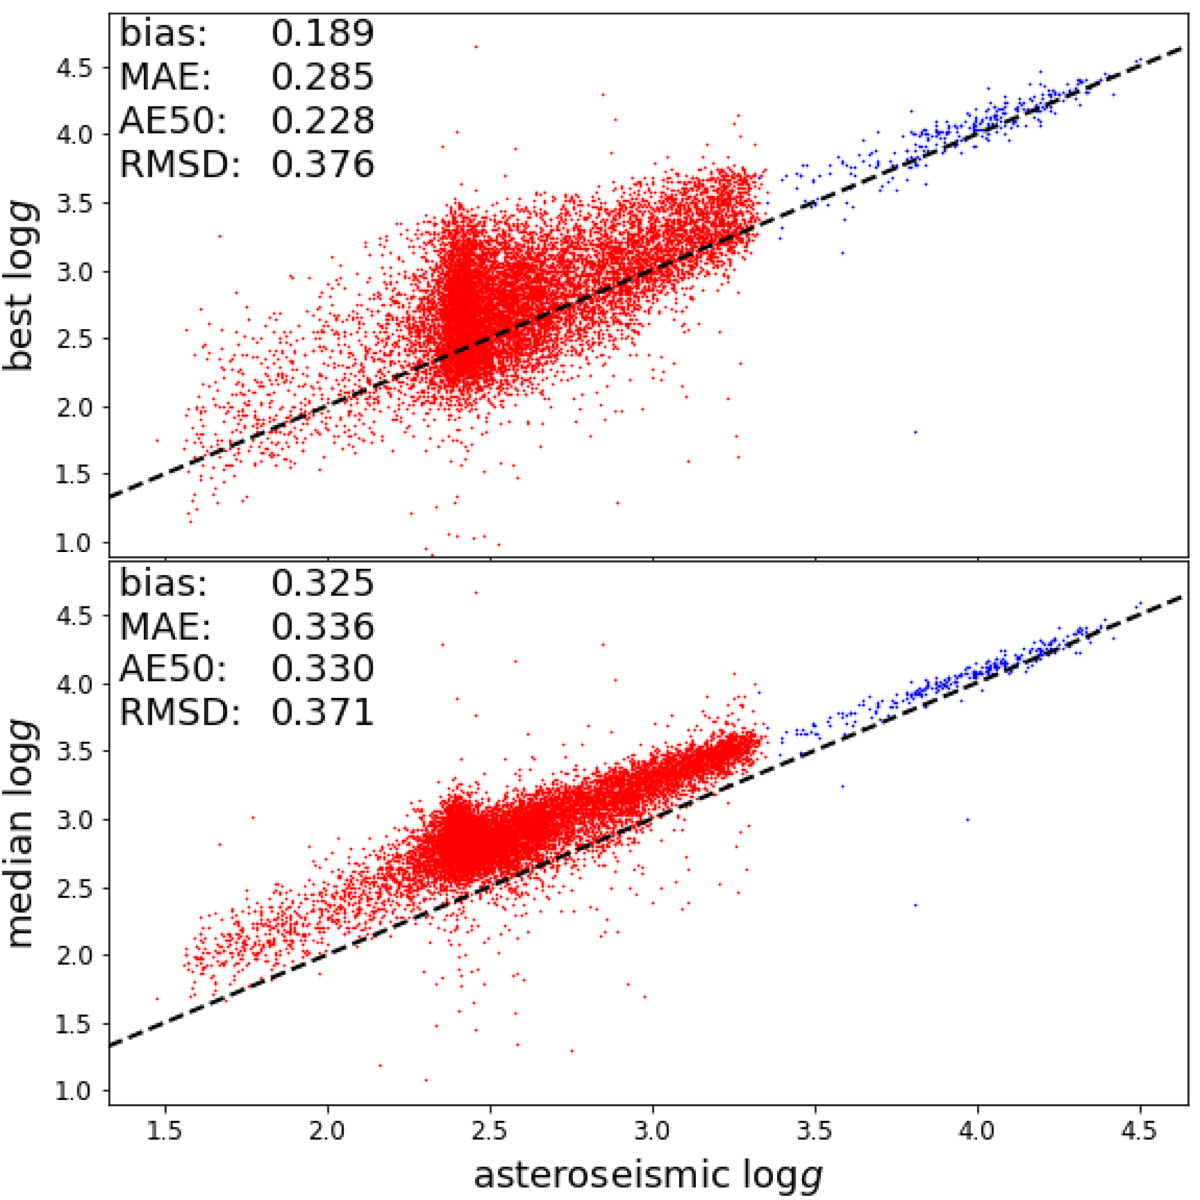
Download original image
Differences in our maximum posterior (top panel) and median (bottom panel) log g estimates compared to asteroseismic values from Serenelli et al. (2017) (main sequence stars; blue points) and Yu et al. (2018) (giant stars; red points).
Current usage metrics show cumulative count of Article Views (full-text article views including HTML views, PDF and ePub downloads, according to the available data) and Abstracts Views on Vision4Press platform.
Data correspond to usage on the plateform after 2015. The current usage metrics is available 48-96 hours after online publication and is updated daily on week days.
Initial download of the metrics may take a while.