Fig. 12.
Download original image
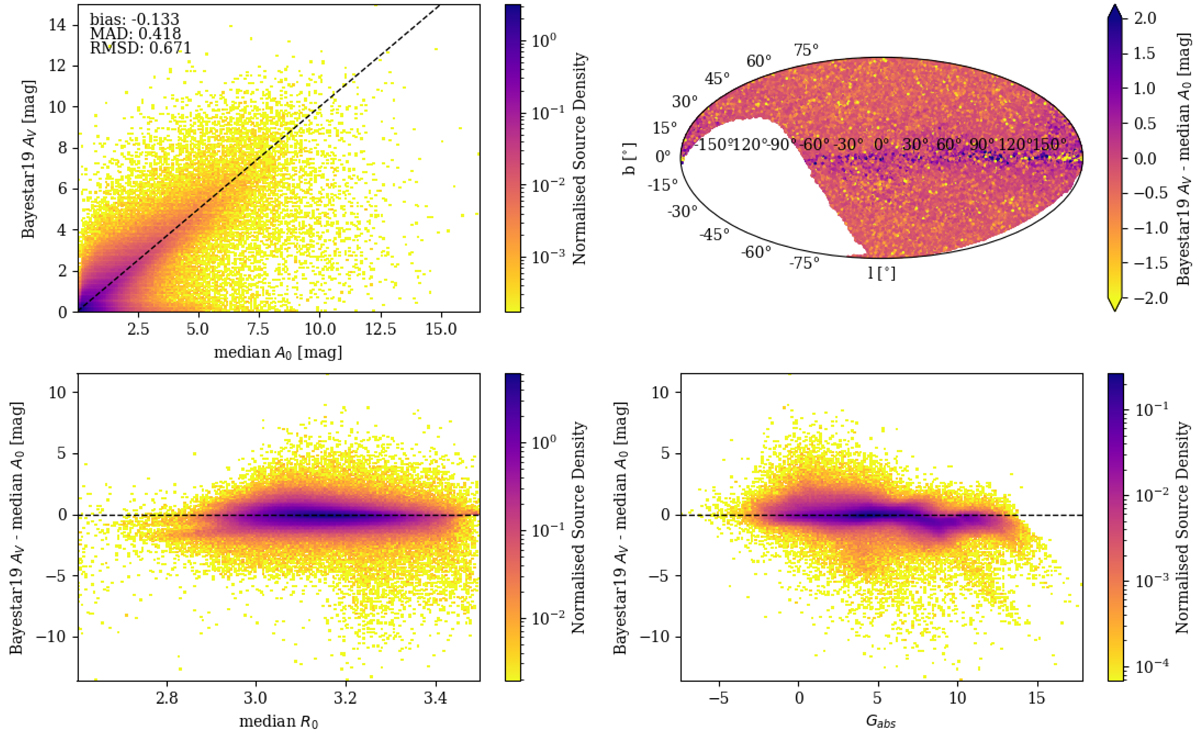
Comparison of our extinctions (median A0) to the Bayestar19 catalog AV for a random sample of 925 527 sources in common. The dashed black lines in each plot represent the 1:1 line. Top left: our median A0 compared to Bayestar19 AV. Top right: residuals of Bayestar19 AV – our median A0 as a distribution on sky in Galactic coordinates. Bottom left: same residuals compared to our median R0 estimates. Bottom right: same residuals compared to our median estimate of intrinsic absolute magnitude, Gabs.
Current usage metrics show cumulative count of Article Views (full-text article views including HTML views, PDF and ePub downloads, according to the available data) and Abstracts Views on Vision4Press platform.
Data correspond to usage on the plateform after 2015. The current usage metrics is available 48-96 hours after online publication and is updated daily on week days.
Initial download of the metrics may take a while.