Open Access
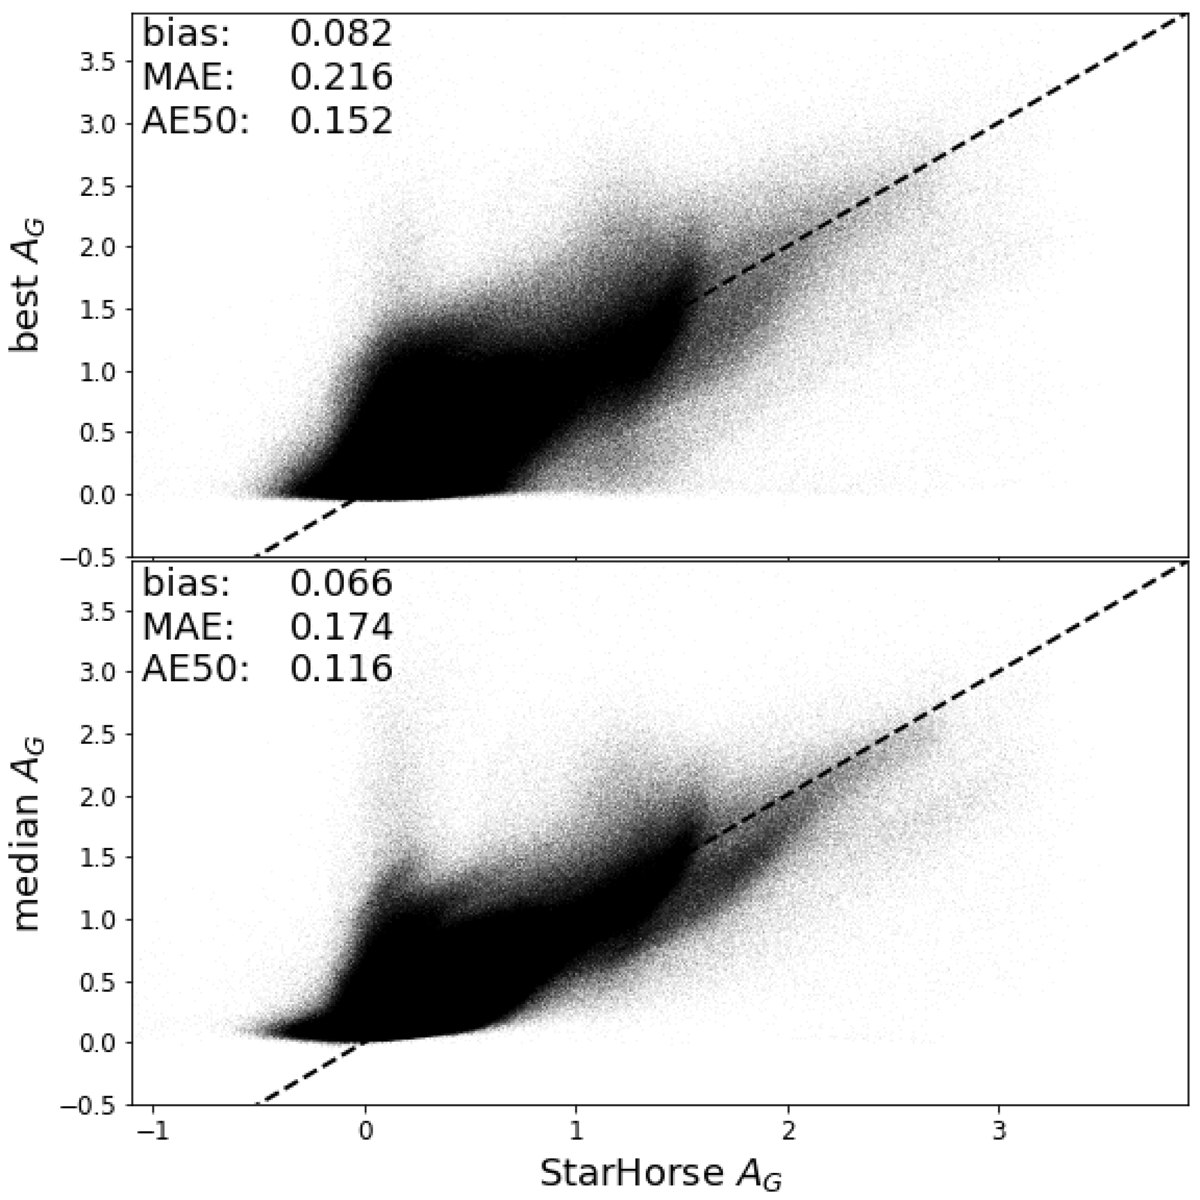
Fig. 11.
Download original image
Differences in AG extinction estimates between our best result (top panel) and our median result (bottom panel) compared to values from Anders et al. (2019) (they provide median statistics). Numbers quote various statistics to summarize the differences.
Current usage metrics show cumulative count of Article Views (full-text article views including HTML views, PDF and ePub downloads, according to the available data) and Abstracts Views on Vision4Press platform.
Data correspond to usage on the plateform after 2015. The current usage metrics is available 48-96 hours after online publication and is updated daily on week days.
Initial download of the metrics may take a while.