Fig. 4
Download original image
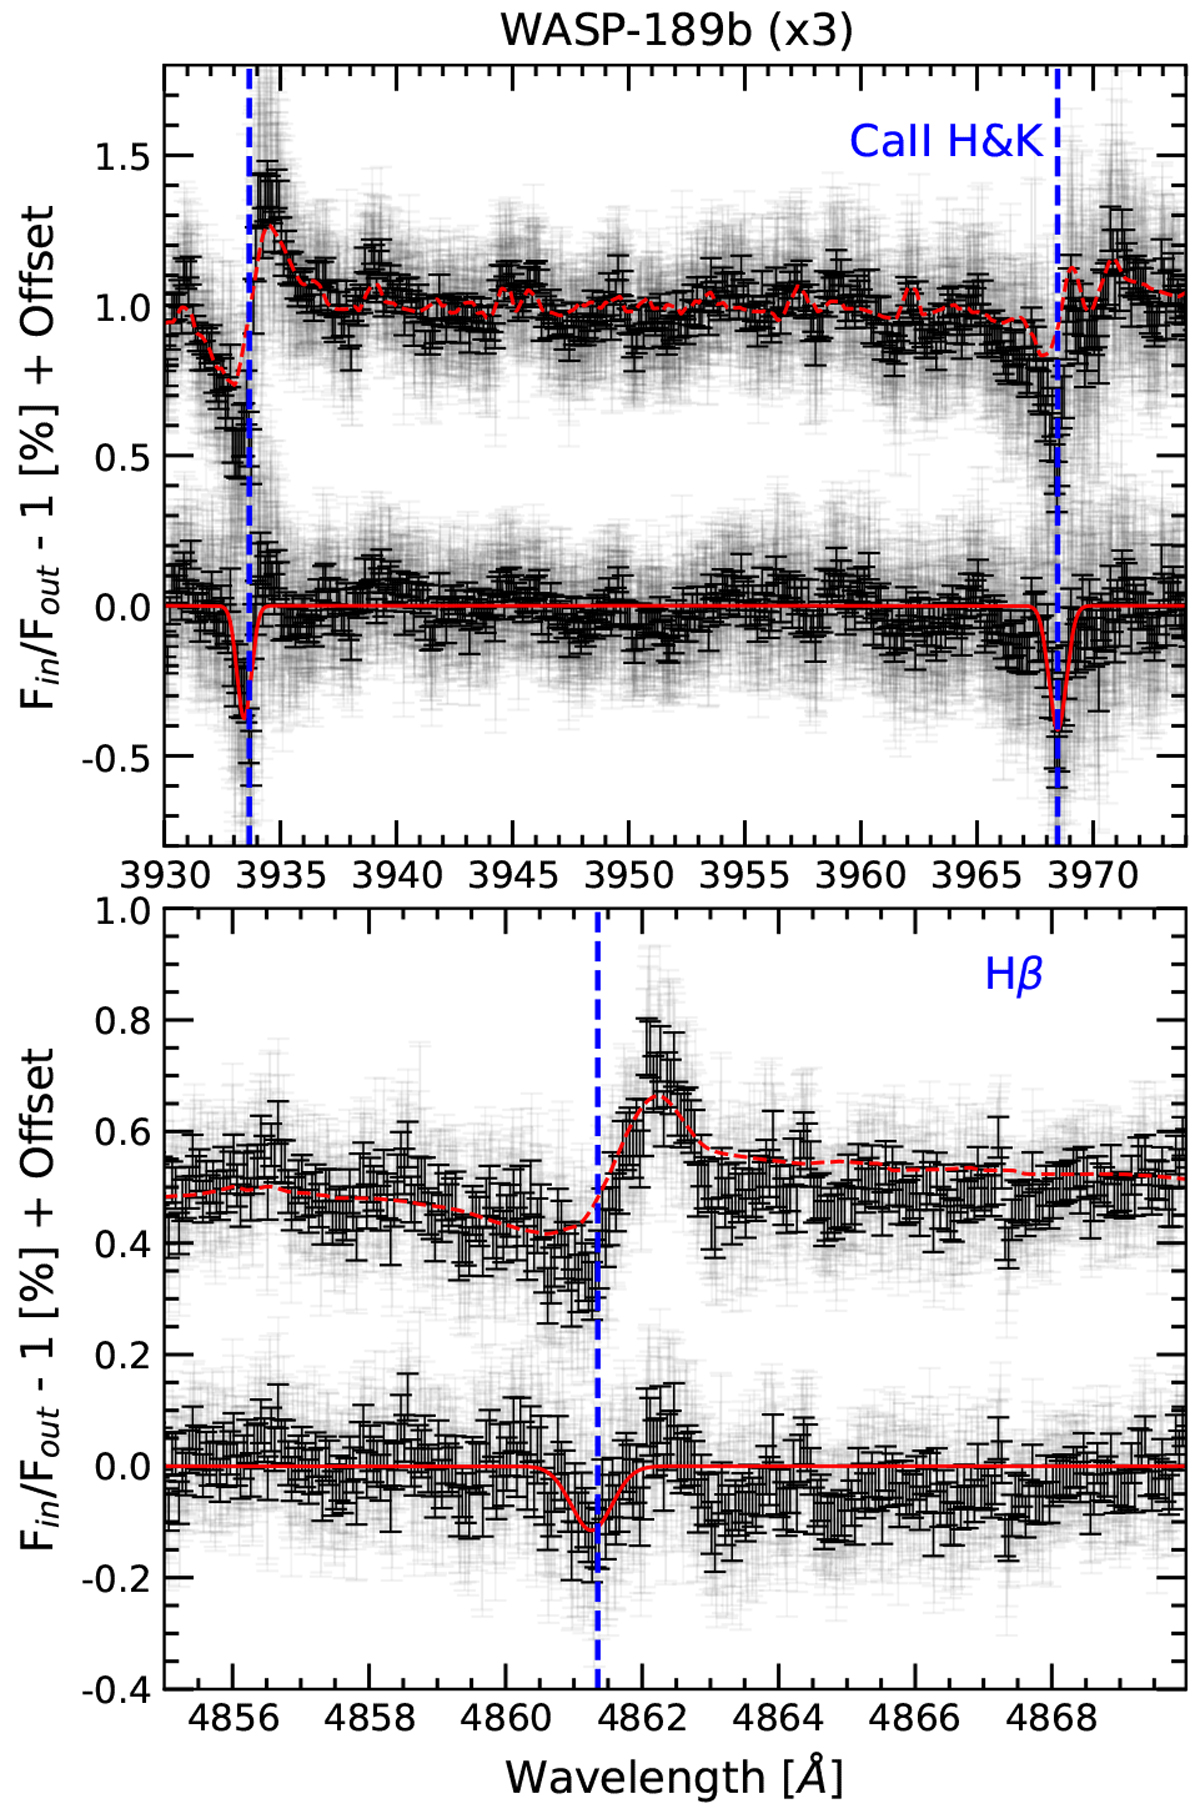
Transmission spectra of WASP-189b around Ca II H&K (top panel) and Hβ (bottom panel) lines. In the top panel, the transmission spectrum shown in black is binned by 0.1 Å, while the transmission spectrum presented in the bottom panel is binned by 0.05 Å. The red dashed lines show the predicted RM effect in the transmission spectrum. The red solid lines show the best-fit Gaussian profile to the transmission spectrum after correcting the RM effect.
Current usage metrics show cumulative count of Article Views (full-text article views including HTML views, PDF and ePub downloads, according to the available data) and Abstracts Views on Vision4Press platform.
Data correspond to usage on the plateform after 2015. The current usage metrics is available 48-96 hours after online publication and is updated daily on week days.
Initial download of the metrics may take a while.