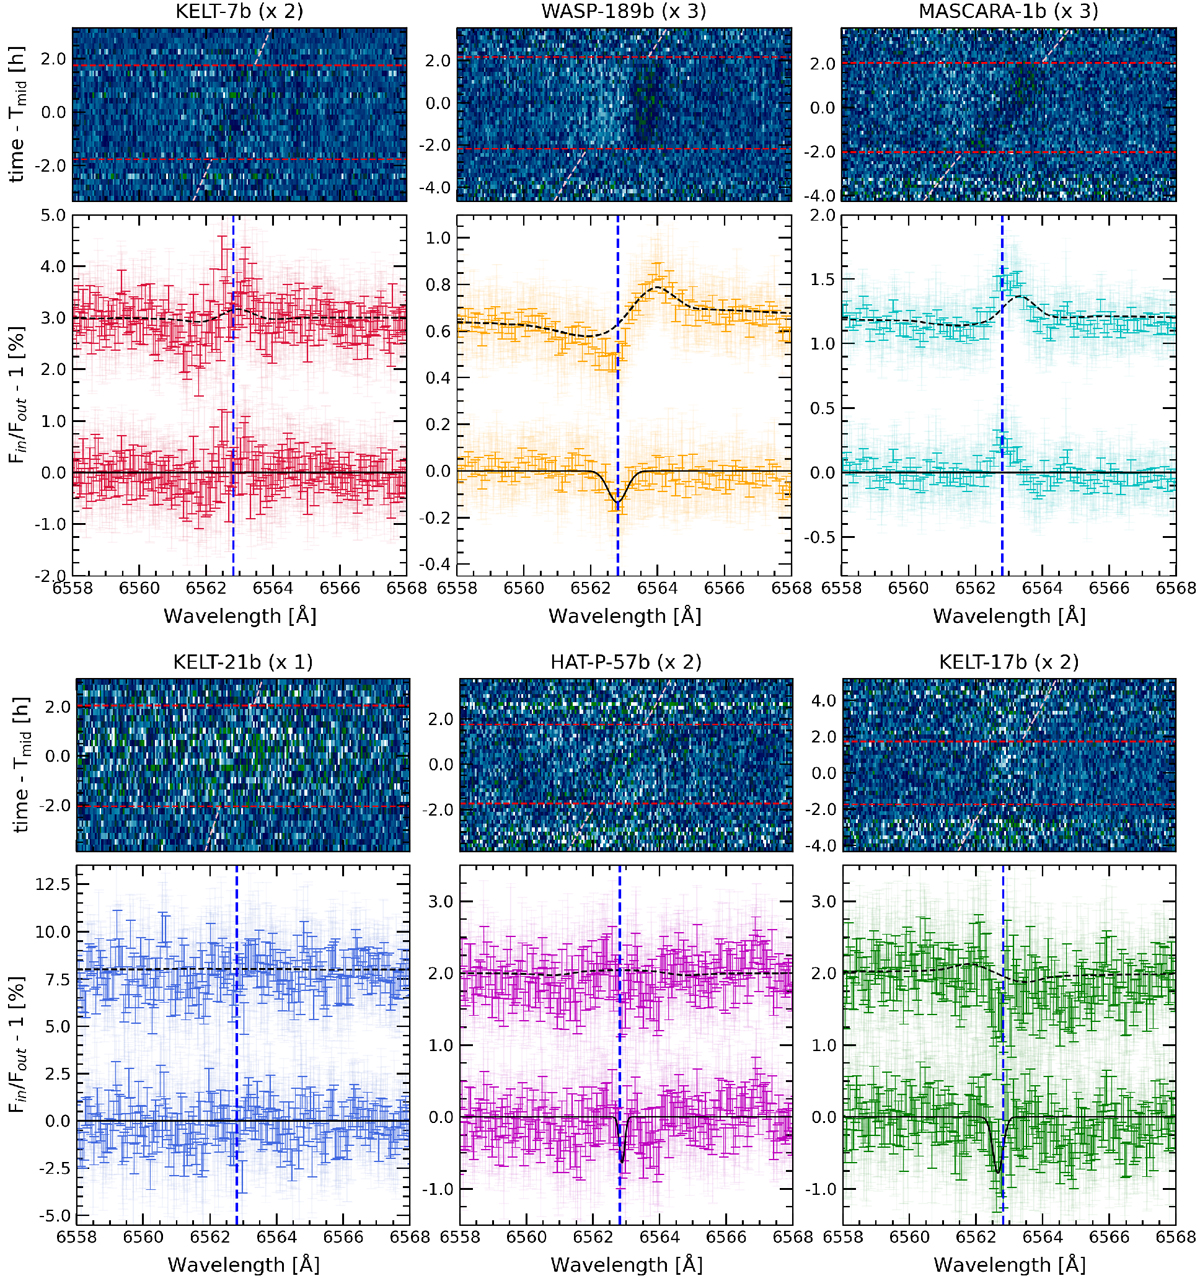
Fig. 1
Download original image
Transmission spectra around the Hα line for the different UHJs analysed in this work (shown in different colors). First row: 2D map around Hα of all nights combined showing the time evolution of the residuals after the spectra have been divided by the master out-of-transit spectrum. For better visualisation of the residuals, the maps include a wavelength binning of 0.05 Å and a 0.003 binning in orbital phase. Second row: in each panel, the top spectrum shows the transmission spectrum without correcting for the RM effect and the bottom spectrum shows the residuals after the correction. We note that the top spectrum has an offset on y-axis for a better visualization. In dashed lines we show the predicted RM effect, computed with the literature stellar and system parameters. In light color, we show the original data, and in solid color the data binned by 0.05 Å. The dashed black line shows the RM model and the black line corresponds to the best fit Gaussian profile to the residuals near the Hα position. The Hα natural position is marked in a blue vertical-dashed line. KELT-21b, KELT-7b, and MASCARA-1b do not show any Gaussian-like residual to be fitted around Hα. The number close to the planet name in the title indicates the number of nights that are combined. We note the different y-axis scales of each panel due to the different S/N of the data.
Current usage metrics show cumulative count of Article Views (full-text article views including HTML views, PDF and ePub downloads, according to the available data) and Abstracts Views on Vision4Press platform.
Data correspond to usage on the plateform after 2015. The current usage metrics is available 48-96 hours after online publication and is updated daily on week days.
Initial download of the metrics may take a while.