Fig. 6.
Download original image
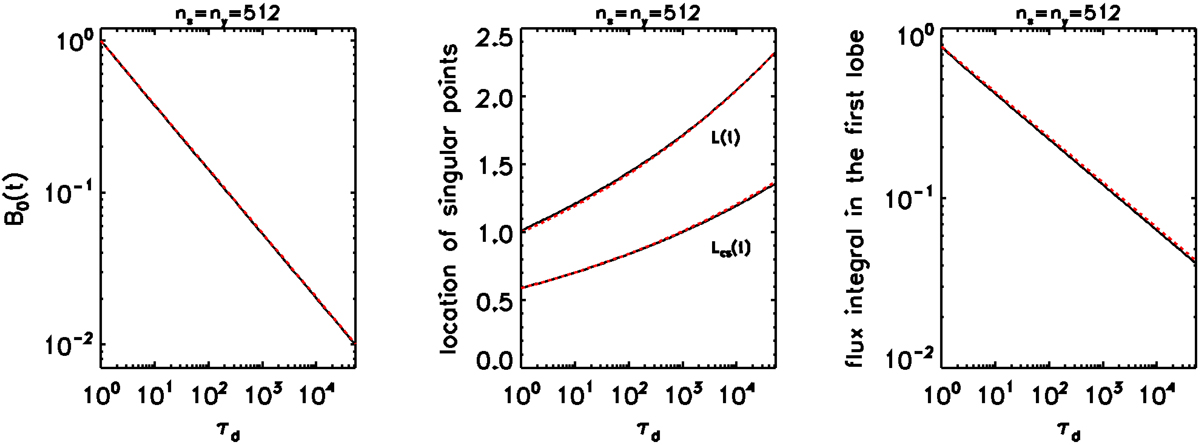
Time evolution of various significant variables in the calculation for the first harmonic illustrated in Fig. 4. Left panel: maximum of the field. Middle panel: location of the singularities, with the upper curve corresponding to L(t), and the lower one to Lcs(t). Right panel: flux integral in the central lobe of the solution. In each panel, the result of the Bifrost calculation is shown as a black solid line and the power laws derived from Eqs. (13)–(15) as red dashed lines.
Current usage metrics show cumulative count of Article Views (full-text article views including HTML views, PDF and ePub downloads, according to the available data) and Abstracts Views on Vision4Press platform.
Data correspond to usage on the plateform after 2015. The current usage metrics is available 48-96 hours after online publication and is updated daily on week days.
Initial download of the metrics may take a while.