Fig. 4.
Download original image
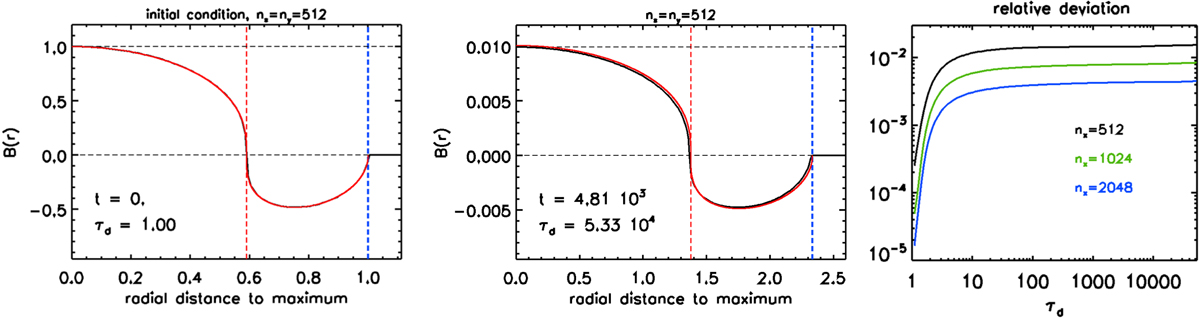
Illustration of the result of the Bifrost runs for the first harmonic. Left panel: theoretical (red) and numerical (black) initial condition for the lowest-resolution case, nx = 512. The positions of the outer front and of the singular current sheet for the numerical solution are marked with dashed blue and red lines, respectively. Two horizontal lines are also superimposed at B(r) = 0 and at the maximum of the field of the numerical curve. Middle panel: configuration at diffusive time τd = 5.3 × 10⁴ (the full time evolution is presented in the accompanying movie, Animation 1). Right panel: relative mutual deviation of the maxima of the theoretical and Bifrost solutions for the three resolution levels used in the test.
Current usage metrics show cumulative count of Article Views (full-text article views including HTML views, PDF and ePub downloads, according to the available data) and Abstracts Views on Vision4Press platform.
Data correspond to usage on the plateform after 2015. The current usage metrics is available 48-96 hours after online publication and is updated daily on week days.
Initial download of the metrics may take a while.