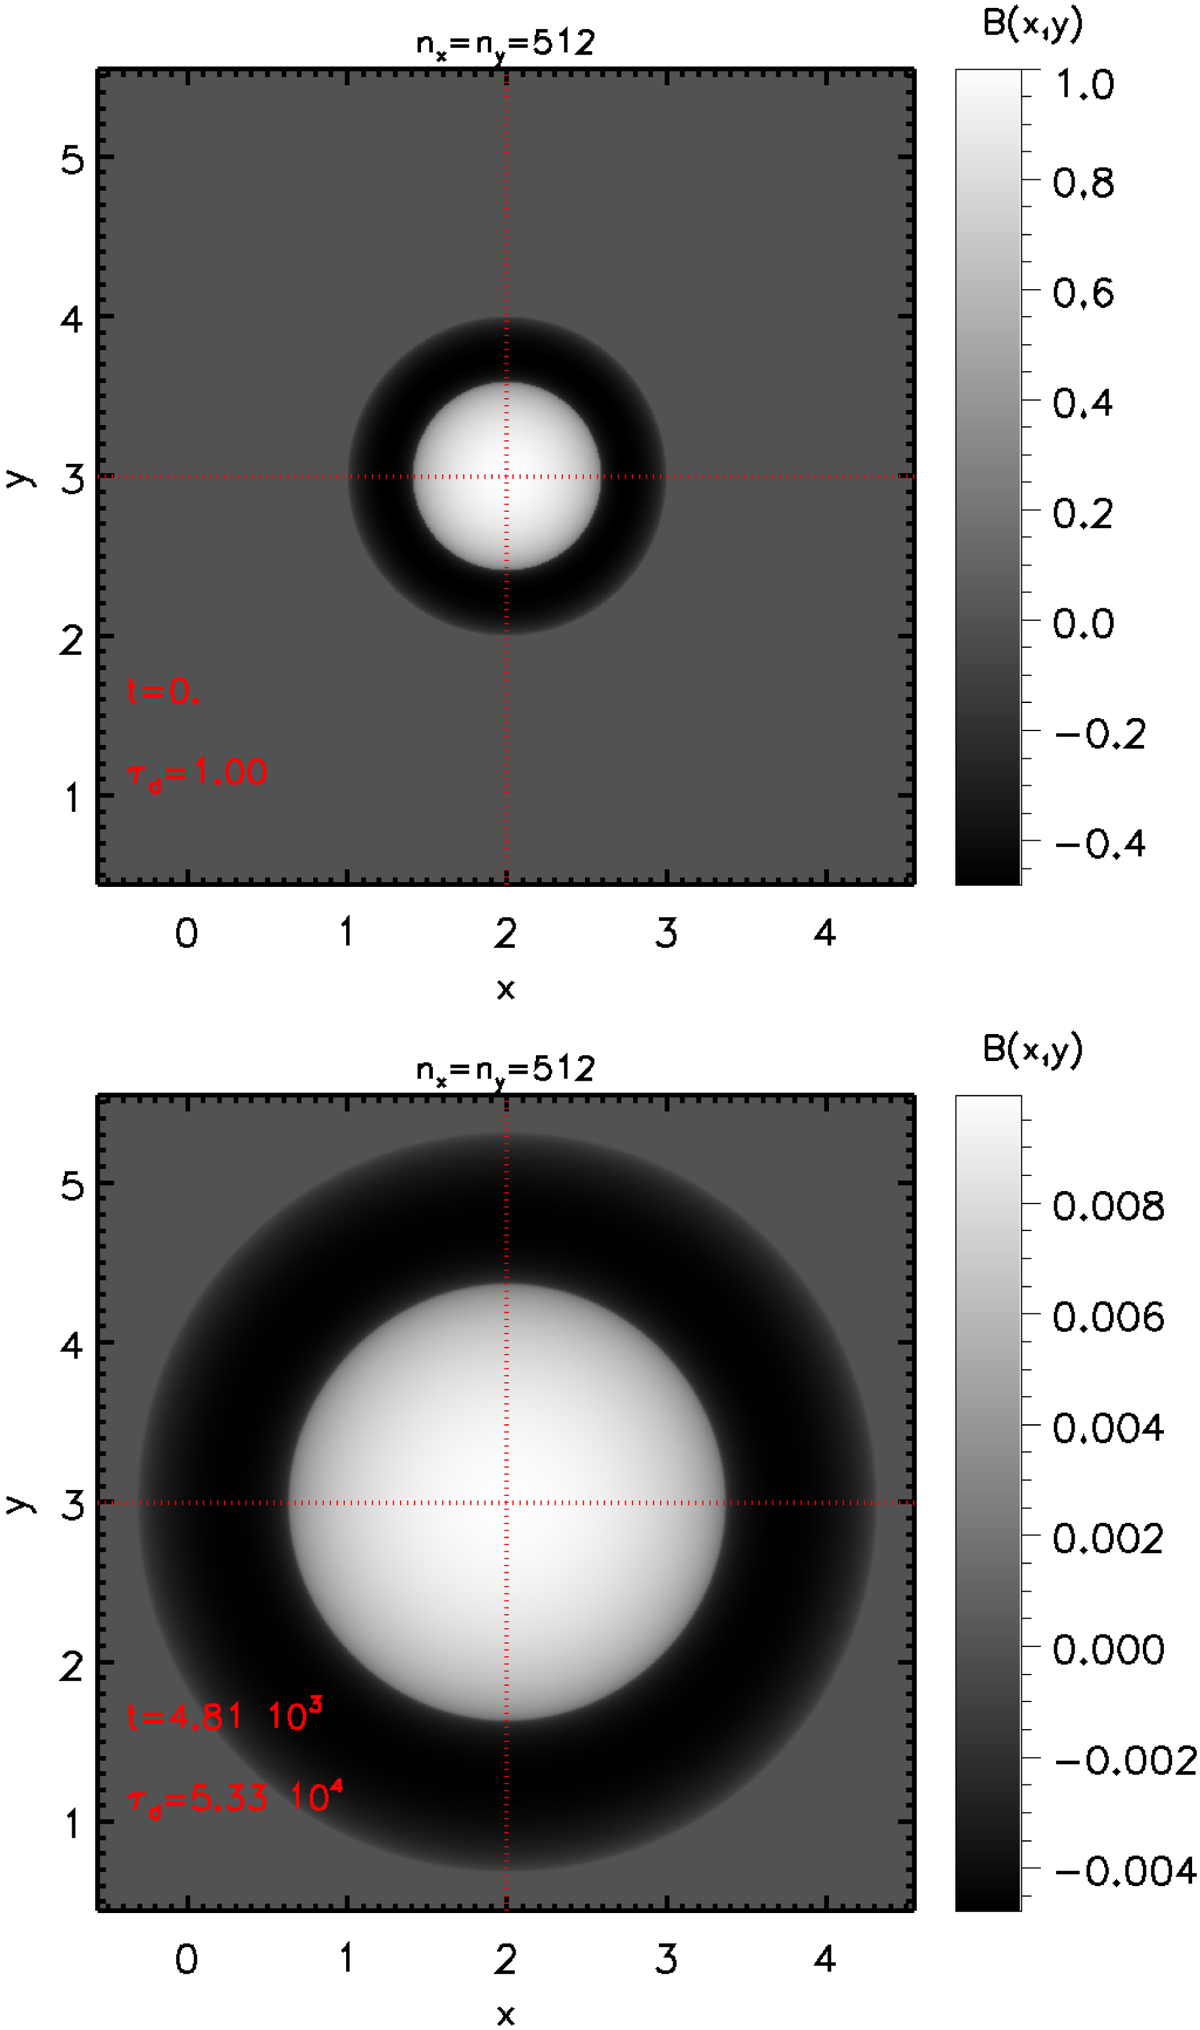
Fig. 3.
Download original image
2D maps B(x, y) showing the result of the Bifrost runs for the first harmonic at the initial time (t = 0; τd = 1; upper panel) and at the end of the run (t = 4.8 × 10³; τd = 5.3 × 10⁴; lower panel). In the figure, the results for the case with the lowest resolution, nx = ny = 512, are presented. The decrease of the field strength with time can be clearly appreciated through the colour bar scales.
Current usage metrics show cumulative count of Article Views (full-text article views including HTML views, PDF and ePub downloads, according to the available data) and Abstracts Views on Vision4Press platform.
Data correspond to usage on the plateform after 2015. The current usage metrics is available 48-96 hours after online publication and is updated daily on week days.
Initial download of the metrics may take a while.