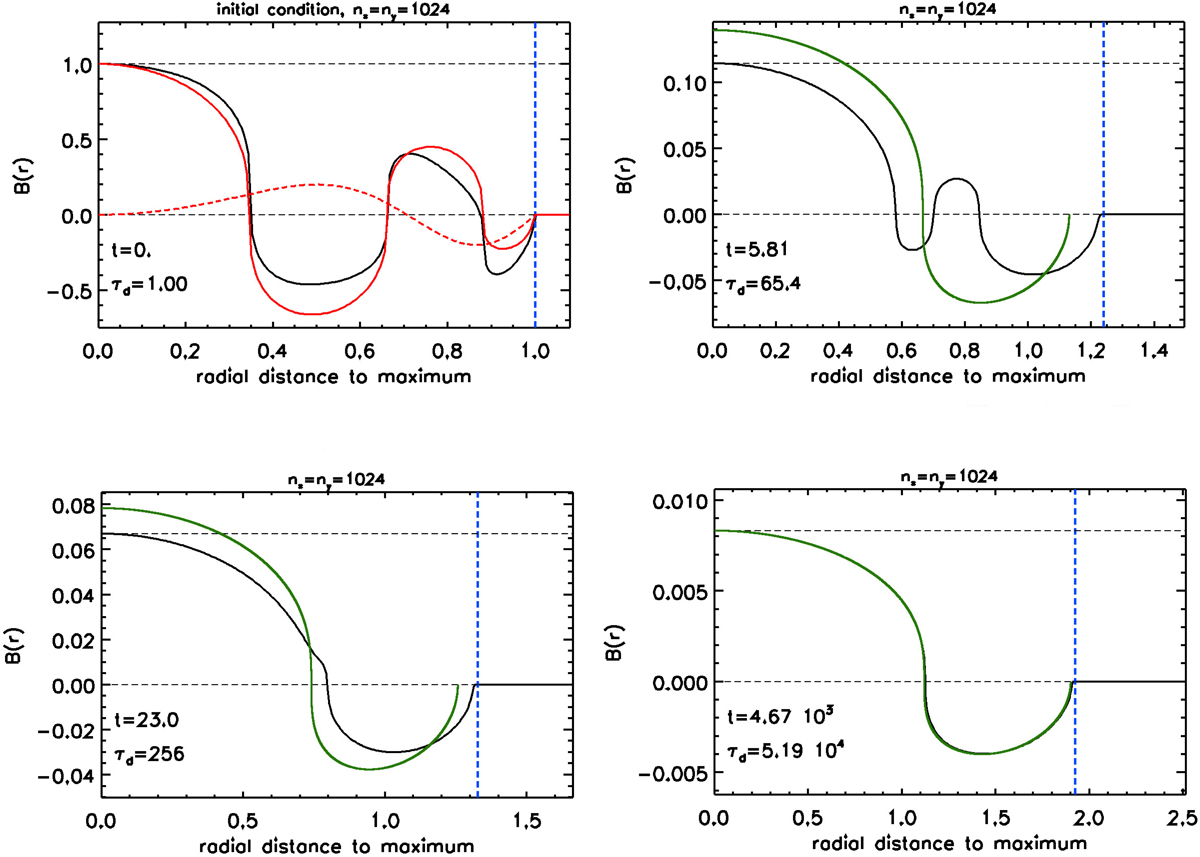
Fig. 10.
Download original image
Selected snapshots from the time evolution of the third harmonic when a non-small perturbation is added initially (see also Animation 4 for a high-cadence display of the evolution). Top left panel: initial condition (black solid), and its components, namely, an exact third harmonic (red solid) and a non-small perturbation (red dashed). The other three panels highlight the gradual conversion of the solution toward the shape of the first harmonic. The green curve corresponds to the time evolution of the first harmonic with unsigned flux and maximum field matching the solution in the final snapshot. The value of τd in the images is calculated with the H and K of the first harmonic (second row in Table 1 after the header). The corresponding values with the H and K for the third harmonic would be: τd = 1; 157; 619 and 1.26 × 10⁵, respectively.
Current usage metrics show cumulative count of Article Views (full-text article views including HTML views, PDF and ePub downloads, according to the available data) and Abstracts Views on Vision4Press platform.
Data correspond to usage on the plateform after 2015. The current usage metrics is available 48-96 hours after online publication and is updated daily on week days.
Initial download of the metrics may take a while.