Fig. A.1.
Download original image
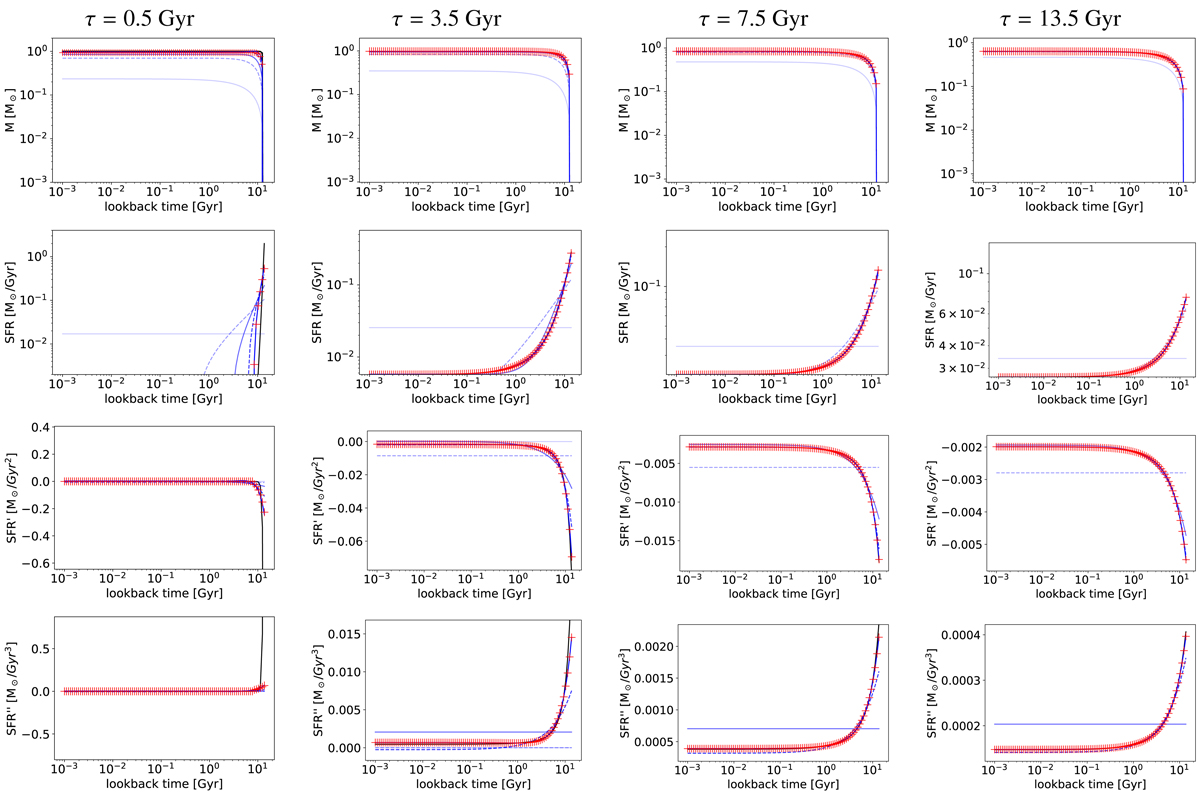
Sample of a MFHs reconstructed with our parametric model from the luminosities of a synthetic exponential SFR with different timescales, τ. With blue lines we plot the stellar mass formed (first row), the SFR (second row), the SFR first derivative (third row), and the SFR second derivative (fourth row), compared to the input model (solid black line). Colour gradients and line styles indicate the degree of the polynomial reconstruction from N = 5 (solid) to lower degrees (more diffuse lines; solid and dashed for odd and even N, respectively). Red crosses correspond to the best positive-SFR fit.
Current usage metrics show cumulative count of Article Views (full-text article views including HTML views, PDF and ePub downloads, according to the available data) and Abstracts Views on Vision4Press platform.
Data correspond to usage on the plateform after 2015. The current usage metrics is available 48-96 hours after online publication and is updated daily on week days.
Initial download of the metrics may take a while.