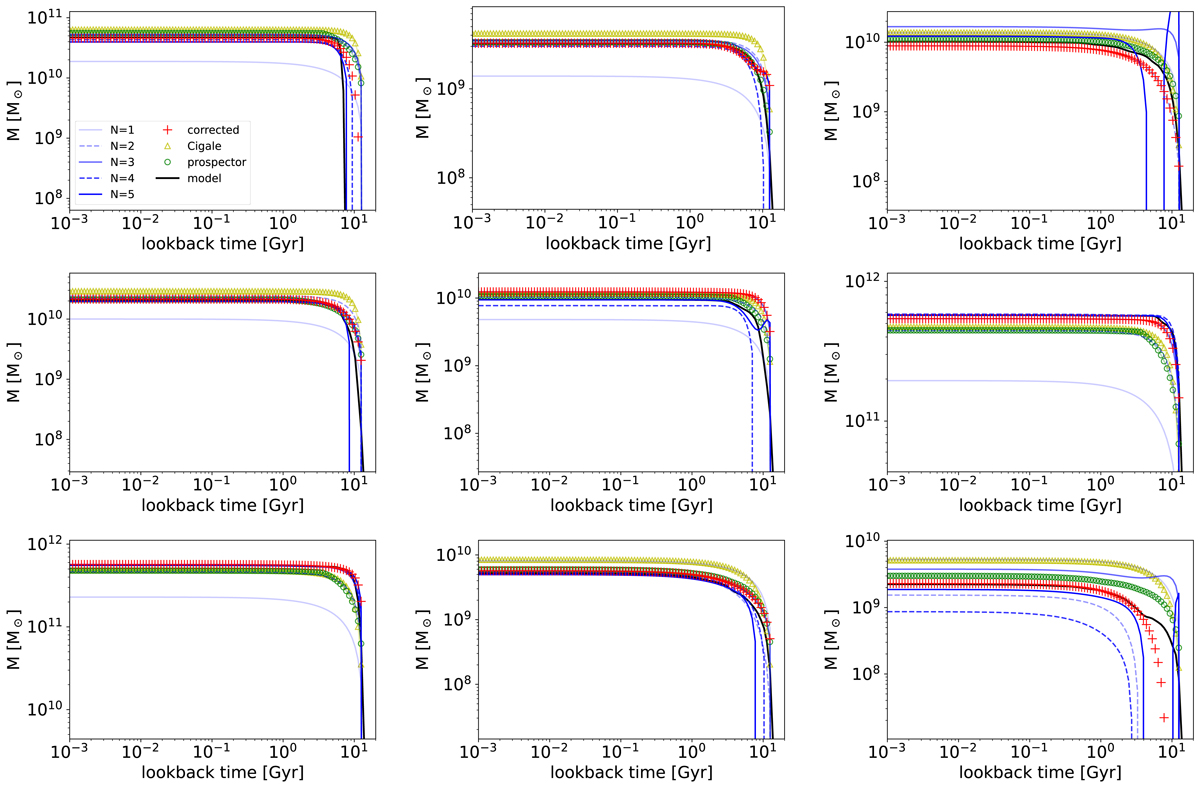
Fig. A.6.
Download original image
Mass formation history for different galaxies of the Illustris sample (black line). The polynomial expansion reconstruction is shown as the different solid (odd degree) and dashed (even degree) blue lines. Results from PROSPECTOR are plotted as green circles, and the results from CIGALE are plotted as yellow triangles. Red crosses correspond to the best positive-SFR fit.
Current usage metrics show cumulative count of Article Views (full-text article views including HTML views, PDF and ePub downloads, according to the available data) and Abstracts Views on Vision4Press platform.
Data correspond to usage on the plateform after 2015. The current usage metrics is available 48-96 hours after online publication and is updated daily on week days.
Initial download of the metrics may take a while.