Fig. 8
Download original image
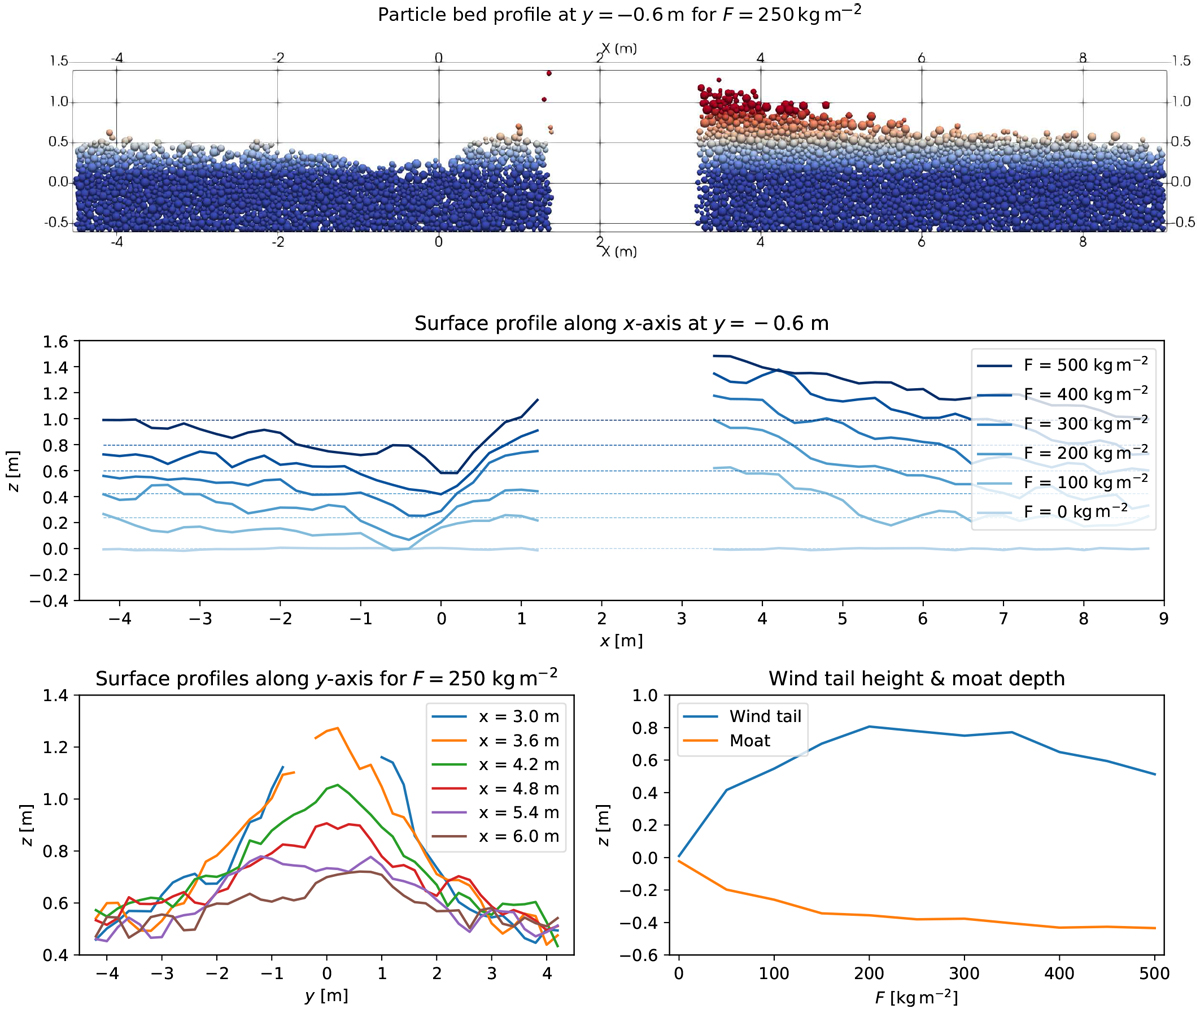
Surface profiles of the reference case (Figs. 9a and 10a). Top panel: cut along the x-axis at y = −0.6 m (because of the asymmetry from rotating the cubic obstacle) of a 3D representation of the particle bed after the insertion of F = 250 kg m−2 of dust. Middle panel: evolution of the surface profile along the x-axis at y = −0.6 m for the reference case and up to a total inserted areal dust mass density of F = 500 kg m−2. The dashed lines are the reference surface levels determined from the less affected outer part of the simulation domain. The obstacle is in the center of the profiles (missing data). Bottom left panel: surface profiles of the wind tail along the y-axis at various distances from the boulder for the case F = 250 kg m−2. Bottom right panel: time evolution of the relative (i.e., with the reference level at this time step subtracted) height of the wind tail (blue solid line) and of the relative depth of the moat (orange solid line). Compare middle and bottom left panels to Fig. 5.
Current usage metrics show cumulative count of Article Views (full-text article views including HTML views, PDF and ePub downloads, according to the available data) and Abstracts Views on Vision4Press platform.
Data correspond to usage on the plateform after 2015. The current usage metrics is available 48-96 hours after online publication and is updated daily on week days.
Initial download of the metrics may take a while.