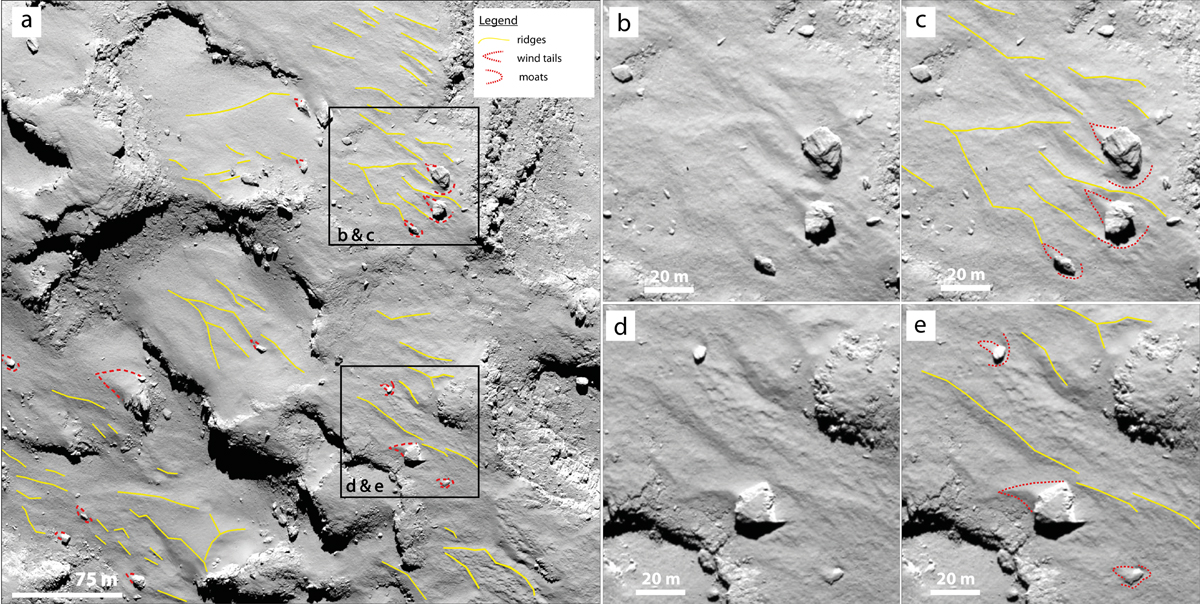
Fig. 1
Download original image
Mapping of aeolian-like morphologies on OSIRIS image data at the Agilkia touchdown 1 site, as an example for the 362 images analyzed. The orientation of the moats, wind tails, and smooth ridges indicate material transport from the same source direction, i.e., from the lower right to the upper left of this image (OSIRIS image NAC_2014-11-12T15.43.51.584Z; image credit: MPS/UPD/LAM/IAA/SSO/INTA/UPM/DASP/IDA).
Current usage metrics show cumulative count of Article Views (full-text article views including HTML views, PDF and ePub downloads, according to the available data) and Abstracts Views on Vision4Press platform.
Data correspond to usage on the plateform after 2015. The current usage metrics is available 48-96 hours after online publication and is updated daily on week days.
Initial download of the metrics may take a while.