Fig. 9
Download original image
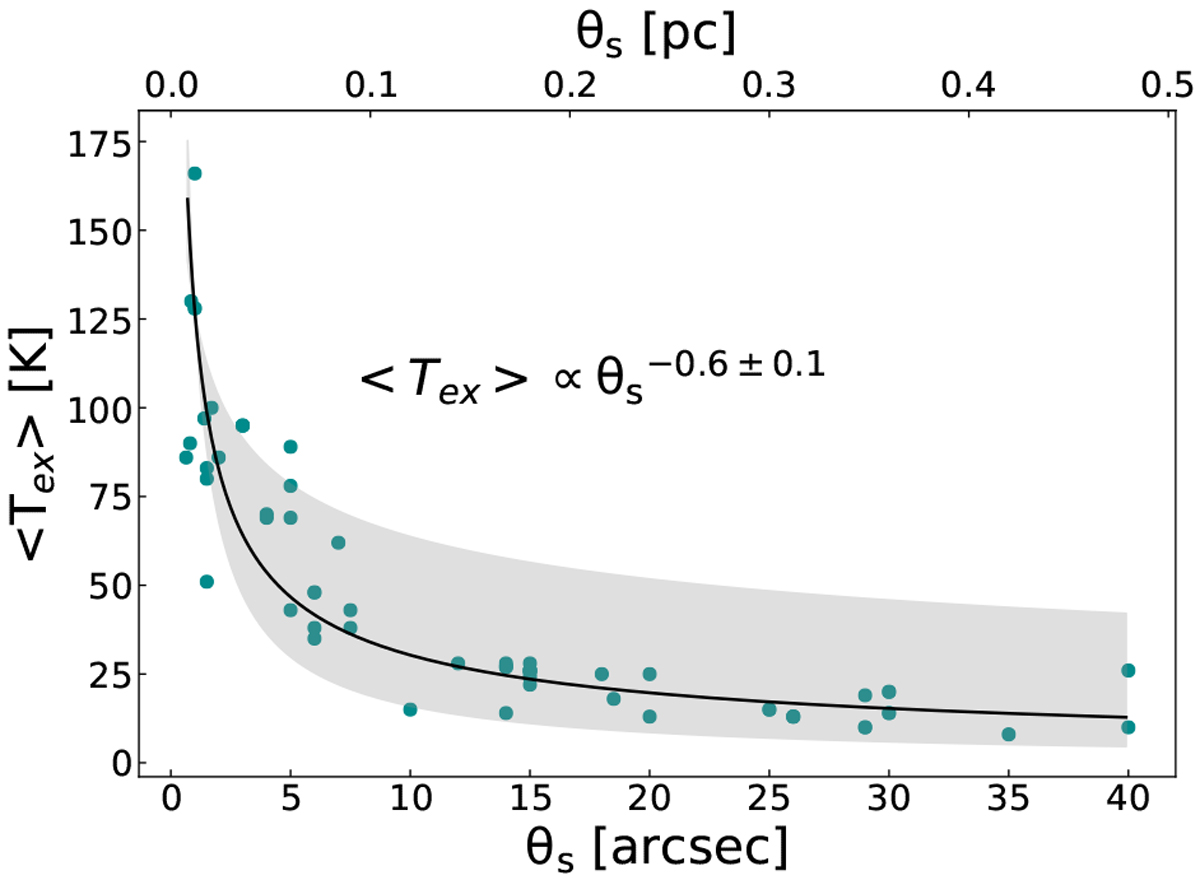
Excitation temperature vs. the size of the emission region for each molecule whose emission arises from the envelope. The black curve represents the power-law fit of the data. The grey area indicates power-law temperature profiles with an exponent between –0.3 and –0.9. This profile does not include the emission originating from the accretion shocks that correspond to a local increase in temperature. It also excludes species for which no strong constraints on the size of the emitting region could be derived (see Sect. 3.4.2).
Current usage metrics show cumulative count of Article Views (full-text article views including HTML views, PDF and ePub downloads, according to the available data) and Abstracts Views on Vision4Press platform.
Data correspond to usage on the plateform after 2015. The current usage metrics is available 48-96 hours after online publication and is updated daily on week days.
Initial download of the metrics may take a while.