Fig. 8
Download original image
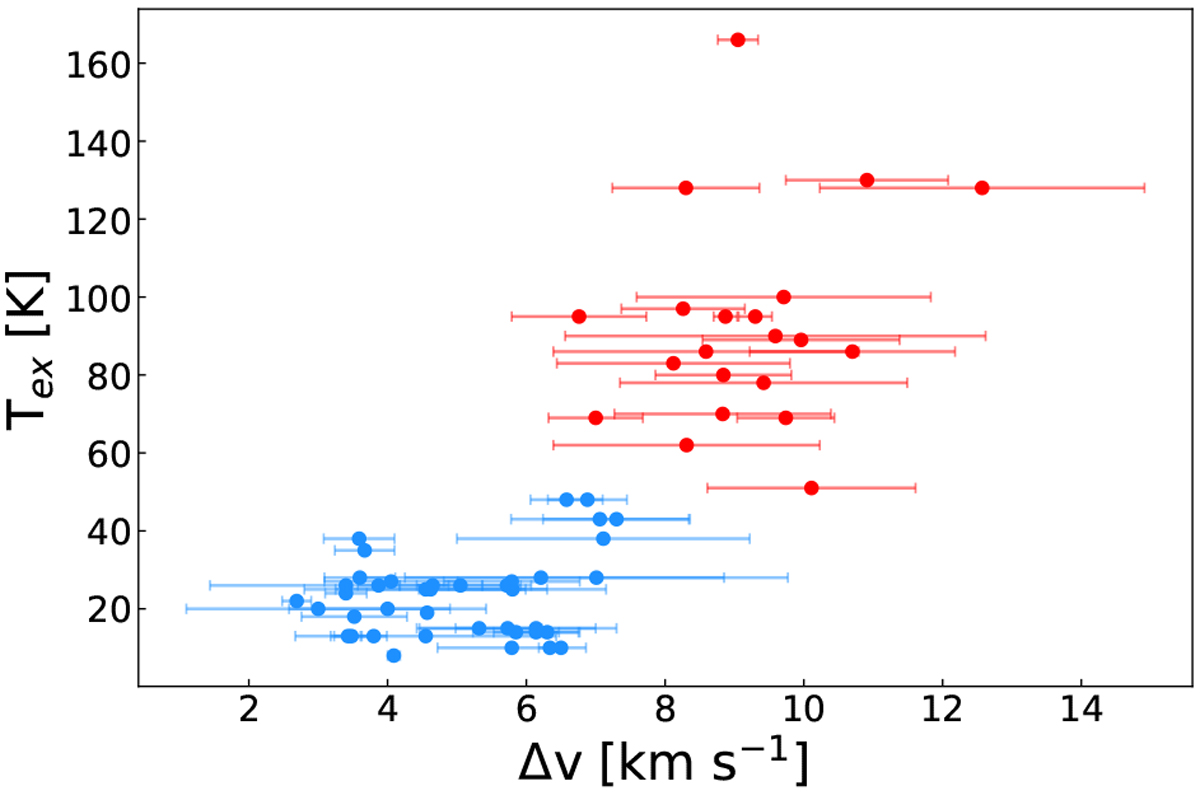
Excitation temperature vs. mean line width. A statistical study of K-Means (MacQueen 1967) was performed to determine the limit between the different components of the envelope. The blue data points represent the cold component, and the warm component of the envelope is represented by the red data points. Single transitions fitted with multiple velocity components are considered as individual measurements in this figure.
Current usage metrics show cumulative count of Article Views (full-text article views including HTML views, PDF and ePub downloads, according to the available data) and Abstracts Views on Vision4Press platform.
Data correspond to usage on the plateform after 2015. The current usage metrics is available 48-96 hours after online publication and is updated daily on week days.
Initial download of the metrics may take a while.