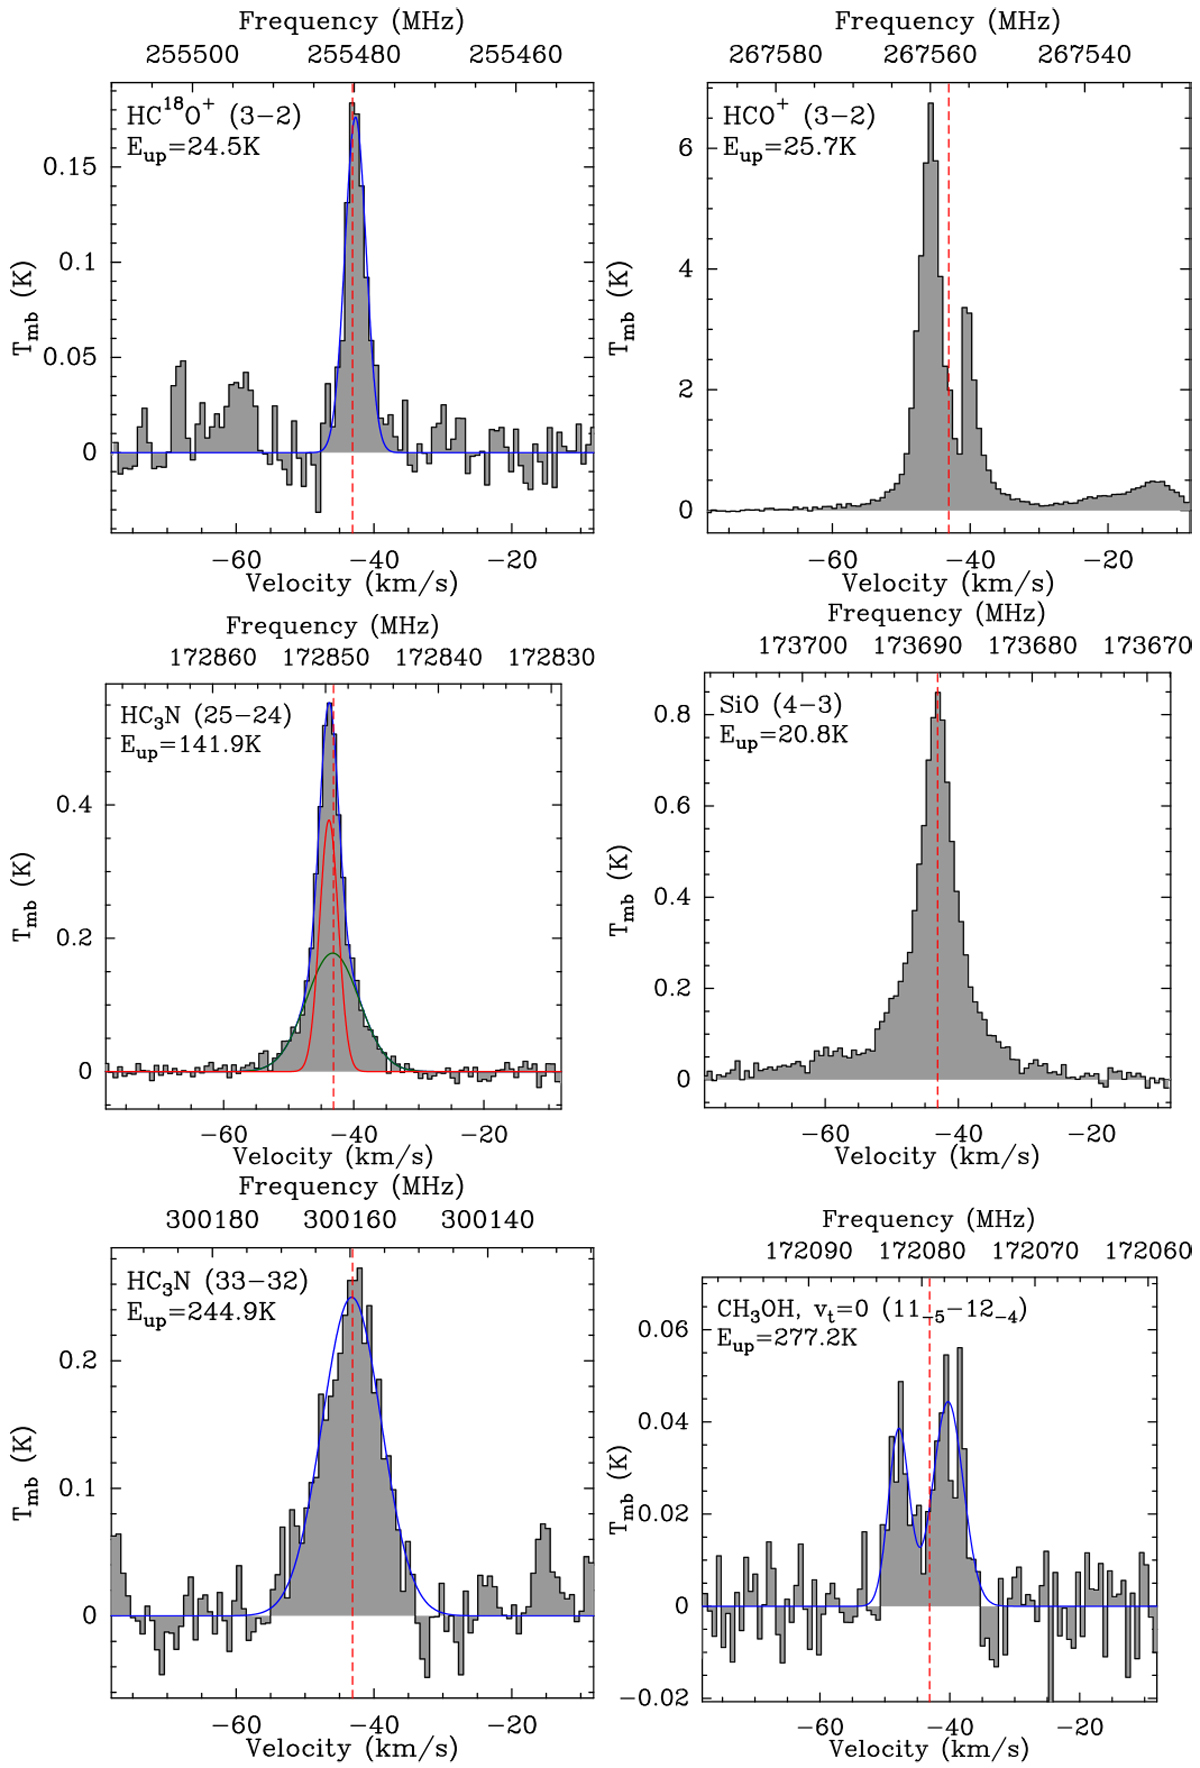
Fig. 5
Download original image
Examples of the different line profiles observed in the spectral survey. From the top to the bottom, we show in the left column a narrow line profile for HC18O+ (3–2) and HC3N (25–24) with a two-component Gaussian fit and HC3N (33–32) with a single broad component. In the right column,HCO+ (3–2) has a line profile with redshifted self-absorption, SiO (4–3) has a broad component coming from the outflow, and the profile of CH3OH (11−5–12−4) shows two velocity components tracing the accretion shocks. All the lines are plotted in a window of 70 km s−1 centred on the rest velocity. The dotted red line shows the systemic velocity of the source at –43.13 km s−1.
Current usage metrics show cumulative count of Article Views (full-text article views including HTML views, PDF and ePub downloads, according to the available data) and Abstracts Views on Vision4Press platform.
Data correspond to usage on the plateform after 2015. The current usage metrics is available 48-96 hours after online publication and is updated daily on week days.
Initial download of the metrics may take a while.