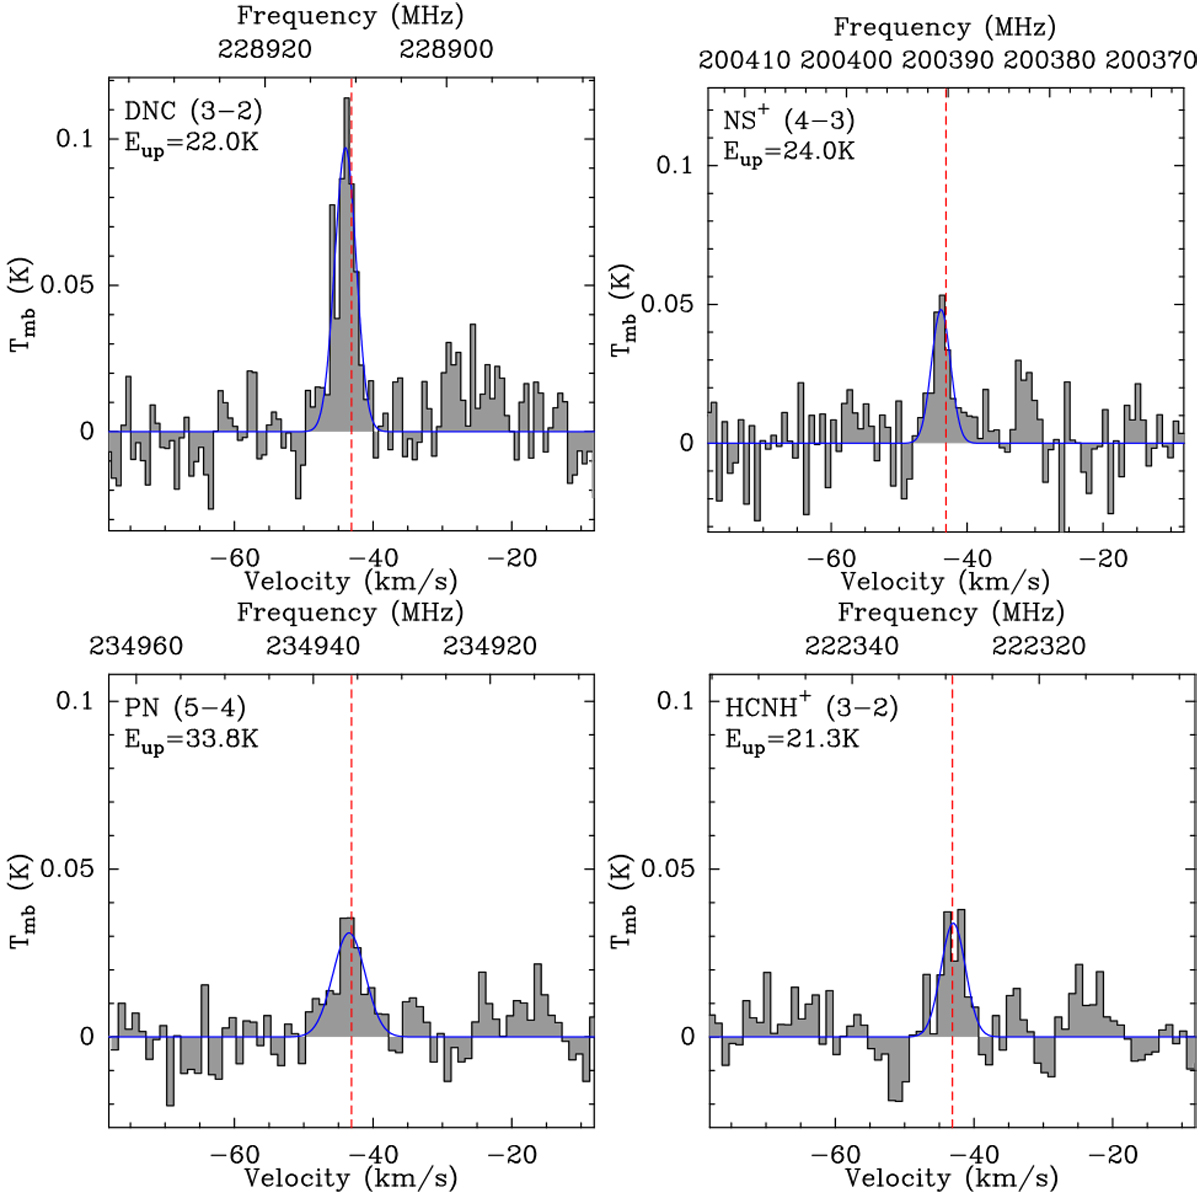
Fig. 4
Download original image
Spectra, in black, of DNC(3–2), NS+ (4–3), PN(5–4), HCNH+ (3–2) shown as filled grey histograms. The dashed red line shows the systemic velocity of the source at –43.13 kms−1 (Csengeri et al. 2018). The blue line represents the best Gaussian fit for each line. Eup represents the upper-level energy of the transition in temperature units.
Current usage metrics show cumulative count of Article Views (full-text article views including HTML views, PDF and ePub downloads, according to the available data) and Abstracts Views on Vision4Press platform.
Data correspond to usage on the plateform after 2015. The current usage metrics is available 48-96 hours after online publication and is updated daily on week days.
Initial download of the metrics may take a while.